Machine Learning Jobs in London

Machine Learning (ML)
England > London

The table below provides summary statistics for permanent job vacancies advertised in London requiring Machine Learning skills. It includes a benchmarking guide to the annual salaries offered in vacancies that cited Machine Learning over the 6 months leading up to 14 June 2025, comparing them to the same period in the previous two years.

6 months to
14 Jun 2025
Same period 2024 Same period 2023
Rank 52 66 100
Rank change year-on-year +14 +34 -57
Permanent jobs citing Machine Learning 689 940 1,034
As % of all permanent jobs advertised in London 5.35% 3.79% 3.33%
As % of the Processes & Methodologies category 5.57% 4.25% 3.50%
Number of salaries quoted 299 633 605
10th Percentile £56,250 £55,000 £53,750
25th Percentile £72,500 £65,000 £65,000
Median annual salary (50th Percentile) £90,000 £85,000 £80,000
Median % change year-on-year +5.88% +6.25% -
75th Percentile £113,750 £107,500 £101,250
90th Percentile £157,000 £127,500 £120,000
England median annual salary £80,000 £70,000 £70,000
% change year-on-year +14.29% - -6.67%

All Process and Methodology Skills
London

Machine Learning falls under the Processes and Methodologies category. For comparison with the information above, the following table provides summary statistics for all permanent job vacancies requiring process or methodology skills in London.

Permanent vacancies with a requirement for process or methodology skills 12,374 22,123 29,569
As % of all permanent jobs advertised in London 96.02% 89.24% 95.10%
Number of salaries quoted 7,002 16,064 21,783
10th Percentile £41,250 £37,500 £42,500
25th Percentile £55,000 £51,250 £55,000
Median annual salary (50th Percentile) £75,000 £70,000 £75,000
Median % change year-on-year +7.14% -6.67% +7.14%
75th Percentile £100,000 £95,000 £95,000
90th Percentile £123,750 £115,000 £116,250
England median annual salary £57,500 £55,000 £62,500
% change year-on-year +4.55% -12.00% +4.17%

Machine Learning
Job Vacancy Trend in London

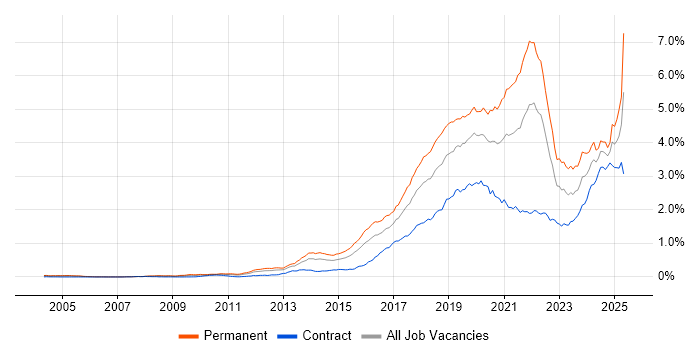
Job postings citing Machine Learning as a proportion of all IT jobs advertised in London.

Job vacancy trend for Machine Learning in London

Machine Learning
Salary Trend in London

3-month moving average salary quoted in jobs citing Machine Learning in London.

Salary trend for Machine Learning in London

Machine Learning
Salary Histogram in London

Salary distribution for jobs citing Machine Learning in London over the 6 months to 14 June 2025.

Salary histogram for Machine Learning in London

Machine Learning
Job Locations in London

The table below looks at the demand and provides a guide to the median salaries quoted in IT jobs citing Machine Learning within the London region over the 6 months to 14 June 2025. The 'Rank Change' column provides an indication of the change in demand within each location based on the same 6 month period last year.

Location Rank Change
on Same Period
Last Year
Matching
Permanent
IT Job Ads
Median Salary
Past 6 Months
Median Salary
% Change
on Same Period
Last Year
Live
Jobs
Central London +19 116 £92,500 +23.33% 1,134
South London +19 23 £75,000 +15.38% 8
West London +34 18 £119,000 +36.00% 26
East London -18 12 £70,000 - 19
North London -6 7 - - 1
Machine Learning
England

Machine Learning
Co-occurring Skills and Capabilities in London by Category

The follow tables expand on the table above by listing co-occurrences grouped by category. The same employment type, locality and period is covered with up to 20 co-occurrences shown in each of the following categories:

Application Platforms
1 61 (8.85%) Apache Spark
2 26 (3.77%) Apache Airflow
3 19 (2.76%) Apache
4 7 (1.02%) SharePoint
5 2 (0.29%) ArcGIS
6 1 (0.15%) Confluence
6 1 (0.15%) Microsoft Exchange
6 1 (0.15%) Oracle Workflow
Applications
1 23 (3.34%) Chatbot
2 9 (1.31%) Maya
3 6 (0.87%) Microsoft Excel
4 5 (0.73%) Adobe Creative Suite
4 5 (0.73%) Blender
4 5 (0.73%) CINEMA 4D
4 5 (0.73%) Microsoft PowerPoint
5 4 (0.58%) Adobe XD
5 4 (0.58%) Microsoft Office
5 4 (0.58%) Sketch
6 1 (0.15%) MS Visio
6 1 (0.15%) Spreadsheet
6 1 (0.15%) SPSS
6 1 (0.15%) SPSS Modeler
Business Applications
1 7 (1.02%) Adaptiv
2 4 (0.58%) Remedy ITSM
2 4 (0.58%) Salesforce CRM
2 4 (0.58%) SAP S/4HANA
3 2 (0.29%) SAP LE
3 2 (0.29%) SAP MM
3 2 (0.29%) SAP SCM
4 1 (0.15%) Oracle EBS
4 1 (0.15%) Oracle ERP
4 1 (0.15%) SAP FI
Cloud Services
1 262 (38.03%) AWS
2 240 (34.83%) Azure
3 142 (20.61%) GCP
4 100 (14.51%) Serverless
5 86 (12.48%) AWS Lambda
6 29 (4.21%) Power Platform
7 27 (3.92%) Amazon S3
8 26 (3.77%) Amazon EKS
8 26 (3.77%) SaaS
9 22 (3.19%) Amazon ECS
10 21 (3.05%) Snowflake
11 20 (2.90%) Azure AI
11 20 (2.90%) dbt
12 19 (2.76%) Azure Machine Learning
13 18 (2.61%) Cloud Computing
14 17 (2.47%) Amazon SageMaker
15 16 (2.32%) Azure Data Factory
16 15 (2.18%) Amazon Bedrock
16 15 (2.18%) PaaS
17 14 (2.03%) Azure Synapse Analytics
Communications & Networking
1 67 (9.72%) Broadband
2 14 (2.03%) HTTP
3 8 (1.16%) VPN
4 3 (0.44%) Firewall
5 2 (0.29%) DNS
5 2 (0.29%) NAS
5 2 (0.29%) SAN
5 2 (0.29%) SD-WAN
5 2 (0.29%) WAN
6 1 (0.15%) BGP
6 1 (0.15%) Internet
6 1 (0.15%) Intrusion Detection
6 1 (0.15%) Network Security
Database & Business Intelligence
1 49 (7.11%) NoSQL
2 46 (6.68%) Data Warehouse
3 39 (5.66%) Big Data
4 29 (4.21%) Power BI
4 29 (4.21%) Relational Database
5 25 (3.63%) Data Lake
6 24 (3.48%) Metadata
7 23 (3.34%) Amazon Redshift
7 23 (3.34%) Hadoop
8 21 (3.05%) PostgreSQL
9 18 (2.61%) Tableau
10 15 (2.18%) Amazon RDS
11 14 (2.03%) Amazon Athena
12 13 (1.89%) BigQuery
13 12 (1.74%) DynamoDB
14 9 (1.31%) Amazon Aurora
14 9 (1.31%) Apache Hive
14 9 (1.31%) MySQL
15 8 (1.16%) Power Query
16 6 (0.87%) Elasticsearch
Development Applications
1 35 (5.08%) Git
2 22 (3.19%) GitLab
3 20 (2.90%) SonarQube
4 19 (2.76%) Sonatype Nexus
5 17 (2.47%) Jenkins
6 16 (2.32%) Vite
7 8 (1.16%) JIRA
8 7 (1.02%) Selenium
8 7 (1.02%) Spinnaker
9 5 (0.73%) CircleCI
9 5 (0.73%) MLflow
10 4 (0.58%) rollup.js
11 3 (0.44%) Locust
11 3 (0.44%) Postman
11 3 (0.44%) SoapUI
12 2 (0.29%) Artifactory
13 1 (0.15%) Bitbucket
13 1 (0.15%) CMake
13 1 (0.15%) Subversion
13 1 (0.15%) Team Foundation Server
General
1 258 (37.45%) Finance
2 185 (26.85%) Law
3 184 (26.71%) Social Skills
4 154 (22.35%) Analytical Skills
5 153 (22.21%) Inclusion and Diversity
6 118 (17.13%) Banking
7 78 (11.32%) Marketing
8 43 (6.24%) Games
8 43 (6.24%) Retail
9 36 (5.22%) Legal
10 27 (3.92%) Manufacturing
11 26 (3.77%) Investment Banking
12 22 (3.19%) Advertising
13 19 (2.76%) Public Sector
14 18 (2.61%) Financial Institution
15 13 (1.89%) Front Office
15 13 (1.89%) Publishing
16 12 (1.74%) Telecoms
17 7 (1.02%) Influencing Skills
17 7 (1.02%) Presentation Skills
Job Titles
1 206 (29.90%) Senior
2 152 (22.06%) Lead
3 133 (19.30%) Software Engineer
4 75 (10.89%) Machine Learning Engineer
5 60 (8.71%) Data Scientist
6 59 (8.56%) Lead Software Engineer
7 53 (7.69%) Senior Software Engineer
8 48 (6.97%) Python Engineer
9 47 (6.82%) Data Engineer
10 43 (6.24%) Architect
11 37 (5.37%) Senior Data Scientist
12 30 (4.35%) AWS Engineer
12 30 (4.35%) Developer
12 30 (4.35%) DevOps Engineer
13 25 (3.63%) Analyst
14 24 (3.48%) Solutions Architect
15 22 (3.19%) Java Engineer
16 21 (3.05%) Product Manager
17 20 (2.90%) Data Architect
17 20 (2.90%) Java Software Engineer
Libraries, Frameworks & Software Standards
1 49 (7.11%) Kafka
2 45 (6.53%) PyTorch
3 40 (5.81%) React
3 40 (5.81%) REST
3 40 (5.81%) TensorFlow
4 37 (5.37%) Pandas
5 32 (4.64%) scikit-learn
6 28 (4.06%) NumPy
7 25 (3.63%) PySpark
8 24 (3.48%) Spring
9 23 (3.34%) SciPy
10 20 (2.90%) CSS
11 19 (2.76%) OpenCV
12 18 (2.61%) HTML
13 17 (2.47%) AngularJS
14 16 (2.32%) RESTful
15 14 (2.03%) .NET
15 14 (2.03%) LangChain
15 14 (2.03%) Web Services
16 13 (1.89%) OAuth
Miscellaneous
1 96 (13.93%) Algorithms
2 75 (10.89%) Cloud Native
3 70 (10.16%) Robotics
4 69 (10.01%) Self-Motivation
5 42 (6.10%) Distributed Systems
6 29 (4.21%) Management Information System
6 29 (4.21%) Product Ownership
7 24 (3.48%) Virtual Team
8 18 (2.61%) Credit Risk
9 17 (2.47%) Enterprise Software
10 15 (2.18%) FMCG
11 13 (1.89%) Data Structures
11 13 (1.89%) Derivative
12 12 (1.74%) Greenfield Project
13 11 (1.60%) Distributed Computing
13 11 (1.60%) Market Risk
14 9 (1.31%) Equities
14 9 (1.31%) Public Cloud
15 8 (1.16%) Equity Derivative
16 7 (1.02%) AI Agents
Operating Systems
1 12 (1.74%) Windows
2 9 (1.31%) Linux
3 5 (0.73%) Mac OS X
3 5 (0.73%) Unix
4 3 (0.44%) VMS
5 2 (0.29%) Robot Operating System
5 2 (0.29%) Windows Server
5 2 (0.29%) Windows Server 2019
6 1 (0.15%) Debian
6 1 (0.15%) Ubuntu
Processes & Methodologies
1 449 (65.17%) Artificial Intelligence
2 268 (38.90%) Agile
3 259 (37.59%) Data Science
4 239 (34.69%) CI/CD
5 233 (33.82%) Problem-Solving
6 226 (32.80%) Analytics
7 184 (26.71%) Software Engineering
8 128 (18.58%) Mentoring
9 122 (17.71%) Computer Science
10 120 (17.42%) DevOps
11 104 (15.09%) LLM
12 96 (13.93%) SDLC
13 91 (13.21%) Data Engineering
14 87 (12.63%) MLOps
15 86 (12.48%) Decision-Making
16 84 (12.19%) Clean Code
17 82 (11.90%) Generative AI
17 82 (11.90%) Operational Stability
17 82 (11.90%) Performance Metrics
18 76 (11.03%) Data Pipeline
Programming Languages
1 424 (61.54%) Python
2 154 (22.35%) SQL
3 96 (13.93%) TypeScript
4 87 (12.63%) Java
5 39 (5.66%) C++
6 35 (5.08%) Scala
7 31 (4.50%) JavaScript
8 22 (3.19%) C#
9 20 (2.90%) R
10 19 (2.76%) C
11 16 (2.32%) Go
11 16 (2.32%) MATLAB
12 15 (2.18%) Kotlin
13 9 (1.31%) Data Analysis Expressions
13 9 (1.31%) Lua
14 7 (1.02%) Rust
15 6 (0.87%) Bicep
15 6 (0.87%) PowerShell
16 5 (0.73%) Bash
16 5 (0.73%) Shell Script
Qualifications
1 261 (37.88%) Degree
2 133 (19.30%) PhD
3 66 (9.58%) Master's Degree
4 55 (7.98%) Computer Science Degree
5 20 (2.90%) AWS Certification
6 19 (2.76%) Azure Certification
6 19 (2.76%) PMI Certification
6 19 (2.76%) Security Cleared
7 18 (2.61%) PMP
8 16 (2.32%) AWS Certified Solutions Architect
9 15 (2.18%) SC Cleared
10 13 (1.89%) CFA
11 10 (1.45%) DBS Check
12 8 (1.16%) DV Cleared
13 7 (1.02%) ITIL Certification
14 4 (0.58%) AWS Certified Developer
15 3 (0.44%) Numerate Degree
16 2 (0.29%) CISM
16 2 (0.29%) CISSP
16 2 (0.29%) TOGAF Certification
Quality Assurance & Compliance
1 37 (5.37%) Data Quality
2 31 (4.50%) GDPR
3 17 (2.47%) Accessibility
4 15 (2.18%) QA
5 13 (1.89%) ISO/IEC 27001
6 11 (1.60%) California Consumer Privacy Act
7 7 (1.02%) NIST
8 6 (0.87%) IFRS
8 6 (0.87%) IFRS 9
9 4 (0.58%) WCAG
10 3 (0.44%) Cyber Essentials
10 3 (0.44%) Cyber Essentials PLUS
11 2 (0.29%) SOC 2
12 1 (0.15%) Actionable Recommendations
12 1 (0.15%) Basel III
12 1 (0.15%) COBIT
12 1 (0.15%) EU AI Act
12 1 (0.15%) HIPAA
12 1 (0.15%) MiFID
12 1 (0.15%) PCI DSS
System Software
1 74 (10.74%) Docker
2 5 (0.73%) Active Directory
2 5 (0.73%) Apache Flume
3 3 (0.44%) Virtual Machines
4 2 (0.29%) Hyper-V
4 2 (0.29%) VMware Infrastructure
5 1 (0.15%) HDFS
Systems Management
1 93 (13.50%) Kubernetes
2 79 (11.47%) Terraform
3 26 (3.77%) Ansible
4 5 (0.73%) Grafana
4 5 (0.73%) Jamf Pro
4 5 (0.73%) Oozie
4 5 (0.73%) Prometheus
5 4 (0.58%) Single Sign-On
6 3 (0.44%) Argo
6 3 (0.44%) Packer
7 2 (0.29%) Microsoft Intune
8 1 (0.15%) Bugsnag
8 1 (0.15%) Istio
8 1 (0.15%) Kibana
8 1 (0.15%) Kubeflow
8 1 (0.15%) logstash
Vendors
1 91 (13.21%) Databricks
2 67 (9.72%) Google
2 67 (9.72%) Microsoft
3 29 (4.21%) OpenAI
4 25 (3.63%) SAP
5 24 (3.48%) Adobe
6 15 (2.18%) ServiceNow
7 14 (2.03%) Apple
8 13 (1.89%) Murex
9 12 (1.74%) Workday
10 9 (1.31%) MKS
10 9 (1.31%) MuleSoft
10 9 (1.31%) Splunk
11 7 (1.02%) FIS
11 7 (1.02%) Foundry
11 7 (1.02%) Oracle
11 7 (1.02%) Palantir
11 7 (1.02%) Salesforce
12 6 (0.87%) Informatica
13 5 (0.73%) Cloudera