Virtual Machines Jobs in London

Virtual Machine (VM)
England > London

The table below provides summary statistics for permanent job vacancies advertised in London requiring Virtual Machines skills. It includes a benchmarking guide to the annual salaries offered in vacancies that cited Virtual Machines over the 6 months leading up to 21 April 2025, comparing them to the same period in the previous two years.

6 months to
21 Apr 2025
Same period 2024 Same period 2023
Rank 337 396 503
Rank change year-on-year +59 +107 +81
Permanent jobs citing Virtual Machines 66 100 151
As % of all permanent jobs advertised in London 0.50% 0.43% 0.41%
As % of the System Software category 3.78% 3.33% 2.60%
Number of salaries quoted 52 85 84
10th Percentile £59,000 £55,000 £40,375
25th Percentile £81,250 £60,000 £53,438
Median annual salary (50th Percentile) £87,500 £73,000 £73,750
Median % change year-on-year +19.86% -1.02% +13.46%
75th Percentile £98,125 £100,000 £94,063
90th Percentile £127,500 £120,000 £118,500
England median annual salary £57,836 £57,500 £57,500
% change year-on-year +0.58% - +15.00%

All System Software Skills
London

Virtual Machines falls under the System Software category. For comparison with the information above, the following table provides summary statistics for all permanent job vacancies requiring system software skills in London.

Permanent vacancies with a requirement for system software skills 1,744 3,007 5,809
As % of all permanent jobs advertised in London 13.23% 12.90% 15.91%
Number of salaries quoted 1,290 2,284 4,170
10th Percentile £36,250 £33,500 £35,625
25th Percentile £50,125 £46,250 £50,000
Median annual salary (50th Percentile) £72,500 £65,000 £70,000
Median % change year-on-year +11.54% -7.14% -
75th Percentile £95,000 £87,500 £91,250
90th Percentile £118,750 £110,000 £110,000
England median annual salary £55,000 £50,000 £55,000
% change year-on-year +10.00% -9.09% -3.51%

Virtual Machines
Job Vacancy Trend in London

Job postings citing Virtual Machines as a proportion of all IT jobs advertised in London.
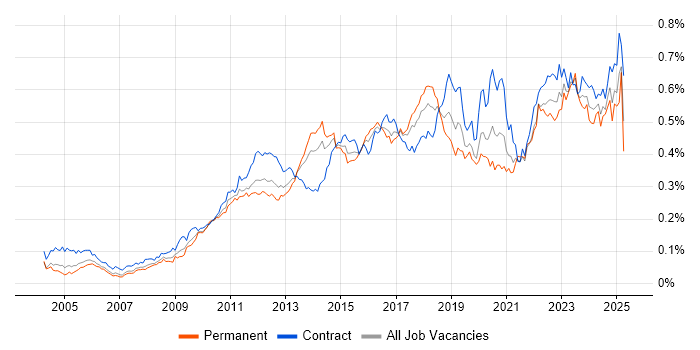
Job vacancy trend for Virtual Machines in London

Virtual Machines
Salary Trend in London

3-month moving average salary quoted in jobs citing Virtual Machines in London.

Salary trend for Virtual Machines in London

Virtual Machines
Salary Histogram in London

Salary distribution for jobs citing Virtual Machines in London over the 6 months to 21 April 2025.

Salary histogram for Virtual Machines in London

Virtual Machines
Job Locations in London

The table below looks at the demand and provides a guide to the median salaries quoted in IT jobs citing Virtual Machines within the London region over the 6 months to 21 April 2025. The 'Rank Change' column provides an indication of the change in demand within each location based on the same 6 month period last year.

Location Rank Change
on Same Period
Last Year
Matching
Permanent
IT Job Ads
Median Salary
Past 6 Months
Median Salary
% Change
on Same Period
Last Year
Live
Jobs
South London +11 5 £75,000 -
Central London +7 5 £87,500 +9.38% 5
Virtual Machines
England

Virtual Machines
Co-occurring Skills and Capabilities in London by Category

The follow tables expand on the table above by listing co-occurrences grouped by category. The same employment type, locality and period is covered with up to 20 co-occurrences shown in each of the following categories:

Application Platforms
1 19 (28.79%) Microsoft Exchange
2 17 (25.76%) SharePoint
3 3 (4.55%) Apache Airflow
4 1 (1.52%) Confluence
4 1 (1.52%) Ethereum
4 1 (1.52%) Oracle SOA Suite
4 1 (1.52%) SAS
4 1 (1.52%) Solana
Applications
1 4 (6.06%) Mozilla Thunderbird
2 2 (3.03%) Microsoft Excel
2 2 (3.03%) Microsoft Office
3 1 (1.52%) Microsoft PowerPoint
3 1 (1.52%) Spreadsheet
Business Applications
1 1 (1.52%) Oracle Applications
1 1 (1.52%) Oracle EBS
Cloud Services
1 52 (78.79%) Azure
2 22 (33.33%) Microsoft 365
3 18 (27.27%) Entra ID
4 17 (25.76%) AWS
4 17 (25.76%) OneDrive
5 14 (21.21%) Power Automate
6 12 (18.18%) GCP
7 11 (16.67%) Azure DevOps
8 10 (15.15%) Azure Monitor
9 6 (9.09%) Amazon EKS
9 6 (9.09%) Amazon MSK
9 6 (9.09%) Azure AKS
9 6 (9.09%) Cloud Computing
9 6 (9.09%) OpenShift
9 6 (9.09%) Serverless
10 5 (7.58%) Azure Machine Learning
10 5 (7.58%) GitHub
11 4 (6.06%) Amazon S3
11 4 (6.06%) Azure Data Factory
11 4 (6.06%) Virtual Private Cloud
Communications & Networking
1 25 (37.88%) Firewall
2 14 (21.21%) DNS
3 13 (19.70%) DHCP
4 12 (18.18%) TCP/IP
5 9 (13.64%) Network Security
6 5 (7.58%) VPN
7 4 (6.06%) SSL
7 4 (6.06%) VLAN
8 3 (4.55%) NAS
9 2 (3.03%) SAN
9 2 (3.03%) Wireless
10 1 (1.52%) Asterisk PBX
10 1 (1.52%) BGP
10 1 (1.52%) DMVPN
10 1 (1.52%) EIGRP
10 1 (1.52%) Ethernet
10 1 (1.52%) Intrusion Detection
10 1 (1.52%) IP Telephony
10 1 (1.52%) Modbus
Database & Business Intelligence
1 9 (13.64%) SQL Server
2 2 (3.03%) Power BI
3 1 (1.52%) Azure SQL Database
3 1 (1.52%) MS Access
3 1 (1.52%) Oracle Database
3 1 (1.52%) Oracle Exadata
3 1 (1.52%) Oracle Reports
Development Applications
1 12 (18.18%) Jenkins
2 4 (6.06%) Bitbucket Server
3 3 (4.55%) Git
3 3 (4.55%) GitLab
3 3 (4.55%) MLflow
4 2 (3.03%) Artifactory
5 1 (1.52%) JIRA
5 1 (1.52%) MSBuild
5 1 (1.52%) NUnit
5 1 (1.52%) Octopus Deploy
General
1 22 (33.33%) Social Skills
2 19 (28.79%) Finance
3 17 (25.76%) Legal
4 11 (16.67%) Banking
5 9 (13.64%) Law
6 4 (6.06%) Analytical Skills
7 3 (4.55%) Investment Banking
8 2 (3.03%) Presentation Skills
8 2 (3.03%) Telecoms
9 1 (1.52%) Advertising
9 1 (1.52%) Back Office
9 1 (1.52%) Front Office
9 1 (1.52%) Inclusion and Diversity
9 1 (1.52%) Marketing
9 1 (1.52%) Military
9 1 (1.52%) Organisational Skills
Job Titles
1 14 (21.21%) DevOps Engineer
2 12 (18.18%) Infrastructure Engineer
3 11 (16.67%) Azure Engineer
4 10 (15.15%) Senior
5 9 (13.64%) Architect
6 8 (12.12%) Cloud Engineer
6 8 (12.12%) Security Engineer
6 8 (12.12%) Solutions Architect
7 7 (10.61%) Lead
8 6 (9.09%) AWS DevOps
8 6 (9.09%) AWS DevOps Engineer
8 6 (9.09%) AWS Engineer
8 6 (9.09%) Kubernetes Engineer
8 6 (9.09%) Machine Learning Engineer
9 4 (6.06%) Analyst
9 4 (6.06%) Lead Cloud Engineer
10 3 (4.55%) Azure DevOps Engineer
10 3 (4.55%) Network Engineer
10 3 (4.55%) Senior AWS DevOps Engineer
10 3 (4.55%) Senior DevOps
Libraries, Frameworks & Software Standards
1 9 (13.64%) ARM Templates
2 6 (9.09%) Kafka
3 5 (7.58%) Azure Blueprints
4 3 (4.55%) Pandas
4 3 (4.55%) PyTorch
4 3 (4.55%) scikit-learn
4 3 (4.55%) TensorFlow
5 2 (3.03%) Anaconda
5 2 (3.03%) JSON
6 1 (1.52%) .NET
6 1 (1.52%) .NET Framework
6 1 (1.52%) 802.1X
6 1 (1.52%) ADO.NET
6 1 (1.52%) ASP.NET
6 1 (1.52%) CSS
6 1 (1.52%) HTML
6 1 (1.52%) Middleware
6 1 (1.52%) NHibernate
6 1 (1.52%) Smart Contracts
6 1 (1.52%) web3js
Miscellaneous
1 20 (30.30%) Management Information System
2 12 (18.18%) Cyber Threat
3 8 (12.12%) Distributed Systems
3 8 (12.12%) Security Posture
4 6 (9.09%) Linux Command Line
5 3 (4.55%) Hedge funds
6 2 (3.03%) Data Centre
6 2 (3.03%) Onboarding
7 1 (1.52%) Bitcoin
7 1 (1.52%) Blockchain
7 1 (1.52%) Clustering
7 1 (1.52%) Cyber Security Posture
7 1 (1.52%) Data Protection Act
7 1 (1.52%) Data Structures
7 1 (1.52%) Enterprise Software
7 1 (1.52%) Fibre Optics
7 1 (1.52%) Operational Technology
7 1 (1.52%) Product Ownership
7 1 (1.52%) Public Cloud
7 1 (1.52%) Web3
Operating Systems
1 16 (24.24%) Windows
2 14 (21.21%) Linux
3 10 (15.15%) Windows Server
4 9 (13.64%) VMS
5 6 (9.09%) Red Hat Enterprise Linux
6 4 (6.06%) Ubuntu
7 2 (3.03%) Windows Server 2016
7 2 (3.03%) Windows Server 2019
8 1 (1.52%) Android
8 1 (1.52%) Unix
8 1 (1.52%) Windows 10
8 1 (1.52%) Windows 7
8 1 (1.52%) Windows Server 2008
Processes & Methodologies
1 35 (53.03%) DevOps
2 20 (30.30%) CI/CD
2 20 (30.30%) Infrastructure Engineering
3 19 (28.79%) Cybersecurity
3 19 (28.79%) Problem-Solving
4 18 (27.27%) Containerisation
5 16 (24.24%) Infrastructure as Code
6 15 (22.73%) Agile
6 15 (22.73%) Identity Management
6 15 (22.73%) Mobile Device Management
6 15 (22.73%) Software Distribution
7 13 (19.70%) Analytics
8 12 (18.18%) Network Design
8 12 (18.18%) Task Automation
9 9 (13.64%) Log Analytics
9 9 (13.64%) Microservices
10 8 (12.12%) Computer Science
10 8 (12.12%) SDLC
11 7 (10.61%) Data Science
11 7 (10.61%) Site Reliability Engineering
Programming Languages
1 36 (54.55%) PowerShell
2 25 (37.88%) Python
3 20 (30.30%) SQL
4 8 (12.12%) Bash
5 6 (9.09%) Go
5 6 (9.09%) Shell Script
6 1 (1.52%) C#
6 1 (1.52%) Java
6 1 (1.52%) JavaScript
6 1 (1.52%) Kusto Query Language
6 1 (1.52%) PL/SQL
6 1 (1.52%) R
6 1 (1.52%) Rust
6 1 (1.52%) Solidity
6 1 (1.52%) TypeScript
Qualifications
1 14 (21.21%) Degree
2 10 (15.15%) Azure Certification
3 6 (9.09%) AWS Certification
3 6 (9.09%) Cisco Certification
3 6 (9.09%) CISSP
3 6 (9.09%) Computer Science Degree
4 5 (7.58%) (ISC)2 CCSP
4 5 (7.58%) CCSP
4 5 (7.58%) Security Cleared
5 4 (6.06%) SC Cleared
6 2 (3.03%) CompTIA Security+
6 2 (3.03%) Master's Degree
7 1 (1.52%) CCNA
7 1 (1.52%) CCNP
7 1 (1.52%) CEH
7 1 (1.52%) Microsoft Certification
Quality Assurance & Compliance
1 14 (21.21%) GDPR
2 8 (12.12%) HIPAA
2 8 (12.12%) SOC 2
3 5 (7.58%) NIST
3 5 (7.58%) PCI DSS
3 5 (7.58%) Sarbanes-Oxley
4 1 (1.52%) Data Quality
4 1 (1.52%) ISO/IEC 27001
System Software
1 24 (36.36%) Docker
2 17 (25.76%) Active Directory
3 7 (10.61%) VMware ESXi
3 7 (10.61%) VMware Infrastructure
4 6 (9.09%) Hyper-V
4 6 (9.09%) Virtual Desktop
5 4 (6.06%) vSphere
Systems Management
1 31 (46.97%) Terraform
2 26 (39.39%) Kubernetes
3 16 (24.24%) Microsoft Intune
4 15 (22.73%) SCCM
4 15 (22.73%) Single Sign-On
5 11 (16.67%) Istio
6 8 (12.12%) Ansible
7 5 (7.58%) CASB
7 5 (7.58%) linkerd
8 4 (6.06%) Nessus
8 4 (6.06%) Proxmox
9 3 (4.55%) Packer
10 1 (1.52%) Grafana
10 1 (1.52%) Oracle RMAN
10 1 (1.52%) Prometheus
10 1 (1.52%) SCVMM
10 1 (1.52%) vCenter Server
Vendors
1 27 (40.91%) Microsoft
2 7 (10.61%) VMware
3 6 (9.09%) Cisco
3 6 (9.09%) Confluent
4 5 (7.58%) Google
4 5 (7.58%) iManage
5 4 (6.06%) Juniper
5 4 (6.06%) Palo Alto
6 3 (4.55%) Arista
6 3 (4.55%) Databricks
6 3 (4.55%) NetApp
6 3 (4.55%) Red Hat
7 2 (3.03%) Citrix
7 2 (3.03%) Dell
7 2 (3.03%) Fortinet
7 2 (3.03%) Oracle
7 2 (3.03%) ServiceNow
8 1 (1.52%) EMC
8 1 (1.52%) EqualLogic
8 1 (1.52%) New Relic