Confluence Job Trends in London

Confluence
England > London

The table below provides summary statistics and salary benchmarking for jobs advertised in London requiring Confluence skills. It covers permanent job vacancies from the 6 months leading up to 21 November 2025, with comparisons to the same periods in the previous two years.

6 months to
21 Nov 2025
Same period 2024 Same period 2023
Rank 244 273 220
Rank change year-on-year +29 -53 -49
Permanent jobs citing Confluence 146 178 278
As % of all permanent jobs in London 1.12% 1.03% 1.48%
As % of the Application Platforms category 11.16% 8.74% 11.96%
Number of salaries quoted 100 111 222
10th Percentile £47,450 £41,250 £46,250
25th Percentile £64,500 £52,500 £54,625
Median annual salary (50th Percentile) £80,000 £60,000 £80,000
Median % change year-on-year +33.33% -25.00% +14.29%
75th Percentile £100,000 £80,000 £90,000
90th Percentile £111,375 £108,750 £105,885
England median annual salary £65,000 £60,000 £70,000
% change year-on-year +8.33% -14.29% +12.00%

All Application Platform Skills
London

Confluence falls under the Application Platforms category. For comparison with the information above, the following table provides summary statistics for all permanent job vacancies requiring application platform skills in London.

Permanent vacancies with a requirement for application platform skills 1,308 2,037 2,325
As % of all permanent jobs advertised in London 10.04% 11.73% 12.36%
Number of salaries quoted 910 1,463 1,866
10th Percentile £35,000 £40,000 £36,250
25th Percentile £50,875 £55,000 £50,000
Median annual salary (50th Percentile) £72,500 £81,000 £67,500
Median % change year-on-year -10.49% +20.00% -
75th Percentile £97,500 £115,000 £87,500
90th Percentile £135,000 £145,000 £110,000
England median annual salary £52,500 £57,500 £55,000
% change year-on-year -8.70% +4.55% -

Confluence
Job Vacancy Trend in London

Historical trend showing the proportion of permanent IT job postings citing Confluence relative to all permanent IT jobs advertised in London.
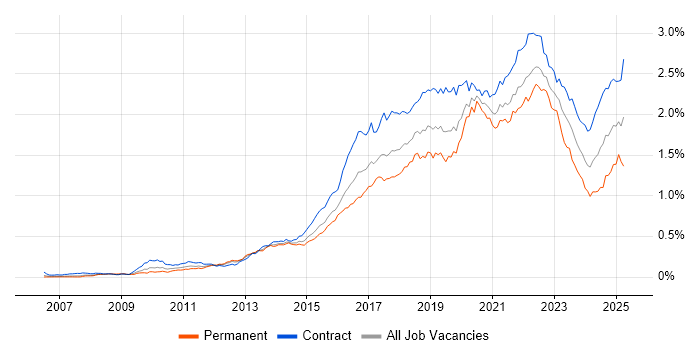
Confluence job vacancy trend in London

Confluence
Salary Trend in London

Salary distribution trend for jobs in London citing Confluence.

Salary distribution trend for jobs in London citing Confluence

Confluence
Salary Histogram in London

Salary distribution for jobs citing Confluence in London over the 6 months to 21 November 2025.

Salary histogram for Confluence in London

Confluence
Job Locations in London

The table below looks at the demand and provides a guide to the median salaries quoted in IT jobs citing Confluence within the London region over the 6 months to 21 November 2025. The 'Rank Change' column provides an indication of the change in demand within each location based on the same 6 month period last year.

Location Rank Change
on Same Period
Last Year
Matching
Permanent
IT Job Ads
Median Salary
Past 6 Months
Median Salary
% Change
on Same Period
Last Year
Live
Jobs
Central London +19 25 £75,000 +25.00% 66
East London - 3 - - 2
South London +30 2 £102,500 +57.69% 3
West London - 1 £34,500 - 2
Confluence
England

Confluence
Co-Occurring Skills & Capabilities in London by Category

The following tables expand on the one above by listing co-occurrences grouped by category. They cover the same employment type, locality and period, with up to 20 co-occurrences shown in each category:

Application Platforms
1 9 (6.16%) SharePoint
2 5 (3.42%) IIS
3 4 (2.74%) Tomcat
4 3 (2.05%) Apache
5 2 (1.37%) Apache Airflow
5 2 (1.37%) MTS
6 1 (0.68%) CMS
6 1 (0.68%) JBoss
6 1 (0.68%) Oracle SOA Suite
6 1 (0.68%) WordPress
Applications
1 9 (6.16%) Microsoft Office
1 9 (6.16%) Microsoft PowerPoint
1 9 (6.16%) MS Visio
2 6 (4.11%) Microsoft Project
3 4 (2.74%) Microsoft Excel
4 2 (1.37%) Adobe XD
4 2 (1.37%) Sketch
5 1 (0.68%) Adobe After Effects
5 1 (0.68%) Adobe Creative Suite
5 1 (0.68%) Adobe Illustrator
5 1 (0.68%) InDesign
5 1 (0.68%) Photoshop
Business Applications
1 6 (4.11%) SAP S/4HANA
2 3 (2.05%) Fidessa
3 2 (1.37%) Bloomberg AIM
4 1 (0.68%) Dynamics CRM
4 1 (0.68%) Dynamics GP
4 1 (0.68%) Endur
4 1 (0.68%) NetSuite
4 1 (0.68%) Oracle BPM
4 1 (0.68%) SAP IBP
4 1 (0.68%) SAP MII
4 1 (0.68%) Shopify
Cloud Services
1 34 (23.29%) Azure
2 19 (13.01%) AWS
3 12 (8.22%) Azure DevOps
3 12 (8.22%) GitHub
4 11 (7.53%) Power Platform
5 10 (6.85%) SaaS
6 9 (6.16%) Figma
6 9 (6.16%) GCP
7 8 (5.48%) Serverless
8 6 (4.11%) Azure Functions
8 6 (4.11%) Microsoft 365
8 6 (4.11%) Power Automate
9 5 (3.42%) OpenShift
10 4 (2.74%) Azure Monitor
10 4 (2.74%) PowerApps
11 3 (2.05%) Azure App Service
11 3 (2.05%) Azure Cosmos DB
11 3 (2.05%) Azure Service Bus
11 3 (2.05%) npm
11 3 (2.05%) Snowflake
Communications & Networking
1 5 (3.42%) DNS
2 3 (2.05%) FIX Connectivity
3 2 (1.37%) Firewall
3 2 (1.37%) Multicast
3 2 (1.37%) SSH
4 1 (0.68%) TCP/IP
4 1 (0.68%) Value-Added Service
4 1 (0.68%) VLAN
4 1 (0.68%) VPN
4 1 (0.68%) WebEx
Database & Business Intelligence
1 29 (19.86%) SQL Server
2 8 (5.48%) MySQL
2 8 (5.48%) PostgreSQL
3 7 (4.79%) Power BI
4 6 (4.11%) DB2
4 6 (4.11%) MongoDB
5 4 (2.74%) Data Warehouse
5 4 (2.74%) NoSQL
6 3 (2.05%) Azure SQL Database
6 3 (2.05%) BigQuery
6 3 (2.05%) Tableau
7 2 (1.37%) Oracle Database
7 2 (1.37%) SQL Server Integration Services
7 2 (1.37%) SQL Server Reporting Services
8 1 (0.68%) Amazon RDS
8 1 (0.68%) Big Data
8 1 (0.68%) DynamoDB
8 1 (0.68%) Elasticsearch
8 1 (0.68%) Hadoop
8 1 (0.68%) Oracle Exadata
Development Applications
1 135 (92.47%) JIRA
2 22 (15.07%) Git
3 15 (10.27%) Jenkins
4 14 (9.59%) Bitbucket
5 10 (6.85%) Selenium
6 9 (6.16%) TeamCity
7 7 (4.79%) Cucumber
8 6 (4.11%) GitLab
9 4 (2.74%) Atlassian Bamboo
9 4 (2.74%) Postman
10 3 (2.05%) Artifactory
10 3 (2.05%) JMeter
10 3 (2.05%) SpecFlow
10 3 (2.05%) Visual Studio
10 3 (2.05%) Visual Studio Code
10 3 (2.05%) webpack
11 1 (0.68%) Gemini Tracker
11 1 (0.68%) JUnit
11 1 (0.68%) Katalon Studio
General
1 64 (43.84%) Social Skills
2 61 (41.78%) Finance
3 32 (21.92%) Analytical Skills
4 28 (19.18%) Banking
5 13 (8.90%) Front Office
6 12 (8.22%) Marketing
7 10 (6.85%) Law
8 9 (6.16%) Inclusion and Diversity
9 8 (5.48%) Documentation Skills
9 8 (5.48%) Financial Institution
9 8 (5.48%) Organisational Skills
10 7 (4.79%) Billing
10 7 (4.79%) Public Sector
11 6 (4.11%) Spanish Language
12 5 (3.42%) Advertising
12 5 (3.42%) Back Office
12 5 (3.42%) Investment Banking
12 5 (3.42%) Retail
13 4 (2.74%) Influencing Skills
13 4 (2.74%) Legal
Job Titles
1 43 (29.45%) Analyst
2 24 (16.44%) Senior
3 23 (15.75%) Business Analyst
4 15 (10.27%) Developer
5 14 (9.59%) Lead
6 12 (8.22%) Support Analyst
7 9 (6.16%) Project Manager
8 8 (5.48%) Applications Support
8 8 (5.48%) Applications Support Analyst
8 8 (5.48%) Product Owner
8 8 (5.48%) Senior Manager
9 7 (4.79%) Java Developer
10 6 (4.11%) .NET Developer
10 6 (4.11%) Agile Developer
10 6 (4.11%) Agile Java Developer
10 6 (4.11%) Software Engineer
11 5 (3.42%) Consultant
11 5 (3.42%) Operations Engineer
11 5 (3.42%) Platform Engineer
11 5 (3.42%) Technical Manager
Libraries, Frameworks & Software Standards
1 20 (13.70%) CSS
2 19 (13.01%) HTML
3 18 (12.33%) React
4 17 (11.64%) Node.js
5 11 (7.53%) Kafka
5 11 (7.53%) RESTful
6 10 (6.85%) .NET
7 9 (6.16%) GraphQL
8 6 (4.11%) Elastic Stack
8 6 (4.11%) Gherkin
9 5 (3.42%) .NET Framework
9 5 (3.42%) Middleware
9 5 (3.42%) REST
10 3 (2.05%) AngularJS
10 3 (2.05%) FIX Protocol
10 3 (2.05%) NHibernate
10 3 (2.05%) RxJS
10 3 (2.05%) SAP Fiori
10 3 (2.05%) SOAP
10 3 (2.05%) Swagger
Miscellaneous
1 16 (10.96%) Product Ownership
2 14 (9.59%) Management Information System
3 12 (8.22%) Greenfield Project
4 11 (7.53%) Cloud Native
5 8 (5.48%) Onboarding
6 6 (4.11%) Distributed Systems
7 4 (2.74%) Equities
7 4 (2.74%) Foreign Exchange (FX)
7 4 (2.74%) Mobile App
7 4 (2.74%) Public Cloud
8 3 (2.05%) Digital Media
8 3 (2.05%) Eurex
8 3 (2.05%) Fixed Income
8 3 (2.05%) Self-Motivation
9 2 (1.37%) Derivative
9 2 (1.37%) Distributed Architecture
9 2 (1.37%) Distributed Computing
9 2 (1.37%) Legacy Systems
9 2 (1.37%) Shadow IT
9 2 (1.37%) Virtual Team
Operating Systems
1 17 (11.64%) Windows
2 15 (10.27%) Linux
3 7 (4.79%) Windows Server
4 6 (4.11%) Unix
5 4 (2.74%) Red Hat Enterprise Linux
5 4 (2.74%) Solaris
5 4 (2.74%) Windows Server 2012
5 4 (2.74%) Windows Server 2016
5 4 (2.74%) Windows Server 2019
6 2 (1.37%) Windows 10
7 1 (0.68%) Mac OS
7 1 (0.68%) Ubuntu
Processes & Methodologies
1 101 (69.18%) Agile
2 47 (32.19%) Problem-Solving
3 33 (22.60%) Continuous Improvement
4 32 (21.92%) Scrum
5 30 (20.55%) DevOps
6 29 (19.86%) Stakeholder Management
7 27 (18.49%) User Stories
8 23 (15.75%) Business Analysis
8 23 (15.75%) User Experience
9 22 (15.07%) Project Management
10 21 (14.38%) Roadmaps
11 20 (13.70%) CI/CD
12 17 (11.64%) AI
13 16 (10.96%) Analytics
13 16 (10.96%) Kanban
14 15 (10.27%) Decision-Making
14 15 (10.27%) Epics
14 15 (10.27%) Microservices
15 14 (9.59%) Business Intelligence
15 14 (9.59%) Project Delivery
Programming Languages
1 34 (23.29%) SQL
2 24 (16.44%) Python
3 18 (12.33%) JavaScript
4 15 (10.27%) TypeScript
5 14 (9.59%) Java
6 11 (7.53%) PowerShell
7 10 (6.85%) C#
8 7 (4.79%) Bash
9 3 (2.05%) Shell Script
10 2 (1.37%) Apex Code
11 1 (0.68%) Bourne shell
11 1 (0.68%) C-shell
11 1 (0.68%) Groovy
11 1 (0.68%) Perl
11 1 (0.68%) RPG
Qualifications
1 21 (14.38%) Degree
2 8 (5.48%) Security Cleared
3 6 (4.11%) SC Cleared
4 5 (3.42%) AWS Certification
4 5 (3.42%) Computer Science Degree
5 4 (2.74%) Azure Certification
5 4 (2.74%) CBAP
6 3 (2.05%) ACCA
6 3 (2.05%) CIMA
6 3 (2.05%) PMI Certification
6 3 (2.05%) SAP Certification
7 2 (1.37%) CFA
7 2 (1.37%) CSPO
8 1 (0.68%) CAPM
8 1 (0.68%) CESG Certified Professional
8 1 (0.68%) ISEB
8 1 (0.68%) ISTQB
8 1 (0.68%) Master's Degree
8 1 (0.68%) Numerate Degree
8 1 (0.68%) PMP
Quality Assurance & Compliance
1 20 (13.70%) Accessibility
2 14 (9.59%) QA
3 7 (4.79%) WCAG
4 3 (2.05%) GDPR
5 2 (1.37%) Basel II
5 2 (1.37%) Data Quality
5 2 (1.37%) MiFID
5 2 (1.37%) PMO
5 2 (1.37%) Sarbanes-Oxley
5 2 (1.37%) UCITS
6 1 (0.68%) California Consumer Privacy Act
6 1 (0.68%) ISO 20022
6 1 (0.68%) ITGC
6 1 (0.68%) PCI DSS
6 1 (0.68%) PERC
6 1 (0.68%) SLA
System Software
1 12 (8.22%) Docker
2 7 (4.79%) Active Directory
3 5 (3.42%) VMware Infrastructure
4 1 (0.68%) Virtual Machines
Systems Management
1 17 (11.64%) Kubernetes
2 7 (4.79%) Terraform
3 5 (3.42%) Ansible
3 5 (3.42%) Puppet
4 4 (2.74%) Progress Chef
5 3 (2.05%) Grafana
6 1 (0.68%) Ambari
6 1 (0.68%) Jamf Pro
6 1 (0.68%) Kibana
6 1 (0.68%) Oracle ZFS
6 1 (0.68%) Prometheus
6 1 (0.68%) Single Sign-On
6 1 (0.68%) VxRail
6 1 (0.68%) ZABBIX
Vendors
1 29 (19.86%) Microsoft
2 20 (13.70%) Atlassian
3 13 (8.90%) Oracle
4 11 (7.53%) Salesforce
5 8 (5.48%) SAP
6 7 (4.79%) Adobe
7 6 (4.11%) Red Hat
7 6 (4.11%) ServiceNow
8 5 (3.42%) Bloomberg
8 5 (3.42%) Google
8 5 (3.42%) VMware
9 3 (2.05%) CQG
9 3 (2.05%) Databricks
9 3 (2.05%) Dynatrace
9 3 (2.05%) ION Trading
9 3 (2.05%) Patsystems
9 3 (2.05%) Qualtrics
9 3 (2.05%) Reuters
9 3 (2.05%) Sybase
9 3 (2.05%) Trayport