PaaS Jobs in London

Platform as a Service (PaaS)
England > London

The table below provides summary statistics for permanent job vacancies advertised in London requiring PaaS skills. It includes a benchmarking guide to the annual salaries offered in vacancies that cited PaaS over the 6 months leading up to 16 May 2025, comparing them to the same period in the previous two years.

6 months to
16 May 2025
Same period 2024 Same period 2023
Rank 243 222 161
Rank change year-on-year -21 -61 +30
Permanent jobs citing PaaS 156 328 769
As % of all permanent jobs advertised in London 1.21% 1.39% 2.28%
As % of the Cloud Services category 2.80% 3.19% 4.52%
Number of salaries quoted 102 261 519
10th Percentile £55,500 £52,500 £52,500
25th Percentile £67,500 £65,000 £60,000
Median annual salary (50th Percentile) £82,500 £82,500 £81,000
Median % change year-on-year - +1.85% -4.71%
75th Percentile £106,250 £101,250 £97,395
90th Percentile £125,750 £113,750 £115,000
England median annual salary £72,500 £70,000 £70,000
% change year-on-year +3.57% - -2.29%

All Cloud Skills
London

PaaS falls under the Cloud Services category. For comparison with the information above, the following table provides summary statistics for all permanent job vacancies requiring cloud computing skills in London.

Permanent vacancies with a requirement for cloud computing skills 5,566 10,293 17,006
As % of all permanent jobs advertised in London 43.18% 43.56% 50.42%
Number of salaries quoted 3,944 8,108 12,606
10th Percentile £42,500 £41,250 £42,500
25th Percentile £56,250 £55,000 £55,000
Median annual salary (50th Percentile) £75,000 £75,000 £75,000
75th Percentile £100,000 £96,000 £96,250
90th Percentile £122,500 £117,500 £115,000
England median annual salary £60,000 £57,500 £65,000
% change year-on-year +4.35% -11.54% +4.00%

PaaS
Job Vacancy Trend in London

Job postings citing PaaS as a proportion of all IT jobs advertised in London.
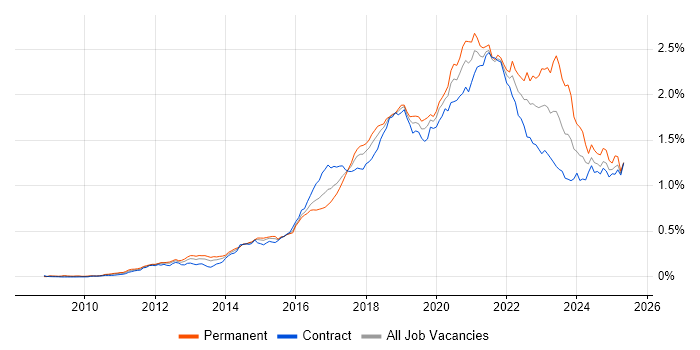
Job vacancy trend for PaaS in London

PaaS
Salary Trend in London

3-month moving average salary quoted in jobs citing PaaS in London.

Salary trend for PaaS in London

PaaS
Salary Histogram in London

Salary distribution for jobs citing PaaS in London over the 6 months to 16 May 2025.

Salary histogram for PaaS in London

PaaS
Job Locations in London

The table below looks at the demand and provides a guide to the median salaries quoted in IT jobs citing PaaS within the London region over the 6 months to 16 May 2025. The 'Rank Change' column provides an indication of the change in demand within each location based on the same 6 month period last year.

Location Rank Change
on Same Period
Last Year
Matching
Permanent
IT Job Ads
Median Salary
Past 6 Months
Median Salary
% Change
on Same Period
Last Year
Live
Jobs
Central London +22 48 £92,500 +4.23% 16
South London - 2 £73,750 - 7
PaaS
England

PaaS
Co-occurring Skills and Capabilities in London by Category

The follow tables expand on the table above by listing co-occurrences grouped by category. The same employment type, locality and period is covered with up to 20 co-occurrences shown in each of the following categories:

Application Platforms
1 16 (10.26%) Microsoft Exchange
2 11 (7.05%) SharePoint
3 4 (2.56%) CMS
3 4 (2.56%) Oracle SOA Suite
4 3 (1.92%) Apache
5 2 (1.28%) Apache Spark
5 2 (1.28%) BizTalk Server
6 1 (0.64%) Apache Airflow
6 1 (0.64%) Confluence
6 1 (0.64%) Ethereum
6 1 (0.64%) OpenStack
Applications
1 8 (5.13%) Microsoft Excel
1 8 (5.13%) MS Visio
2 2 (1.28%) Maya
Business Applications
1 4 (2.56%) Oracle EBS
2 3 (1.92%) Dynamics CRM
3 2 (1.28%) SAP Hybris
4 1 (0.64%) Aladdin
4 1 (0.64%) thinkFolio
Cloud Services
1 122 (78.21%) Azure
2 79 (50.64%) IaaS
2 79 (50.64%) SaaS
3 49 (31.41%) AWS
4 30 (19.23%) Azure DevOps
5 29 (18.59%) Microsoft 365
6 25 (16.03%) GCP
7 18 (11.54%) Entra ID
8 16 (10.26%) GitHub
9 13 (8.33%) GitHub Actions
10 9 (5.77%) Cloud Computing
11 7 (4.49%) Azure ExpressRoute
11 7 (4.49%) Serverless
12 6 (3.85%) Azure Data Factory
12 6 (3.85%) Azure Monitor
13 5 (3.21%) Azure Key Vault
13 5 (3.21%) Power Platform
14 4 (2.56%) Azure Cosmos DB
14 4 (2.56%) Azure Service Bus
14 4 (2.56%) Azure Synapse Analytics
Communications & Networking
1 17 (10.90%) DNS
2 16 (10.26%) Firewall
2 16 (10.26%) VPN
3 14 (8.97%) DHCP
4 10 (6.41%) Network Security
4 10 (6.41%) SAN
4 10 (6.41%) WAN
5 8 (5.13%) Cisco IOS
5 8 (5.13%) FTP
5 8 (5.13%) IPv4
5 8 (5.13%) PBX
5 8 (5.13%) SMTP
5 8 (5.13%) Structured Cabling
5 8 (5.13%) VLAN
6 5 (3.21%) LAN
6 5 (3.21%) SD-WAN
7 4 (2.56%) IPsec
7 4 (2.56%) TCP/IP
8 2 (1.28%) NAS
9 1 (0.64%) AMQP
Database & Business Intelligence
1 8 (5.13%) Amazon RDS
1 8 (5.13%) Data Lake
2 6 (3.85%) Azure SQL Database
2 6 (3.85%) Data Warehouse
2 6 (3.85%) SQL Server
3 5 (3.21%) Power BI
4 4 (2.56%) BigQuery
4 4 (2.56%) PostgreSQL
5 3 (1.92%) MongoDB
5 3 (1.92%) MySQL
5 3 (1.92%) NoSQL
6 2 (1.28%) Azure SQL Data Warehouse
6 2 (1.28%) Big Data
6 2 (1.28%) HDInsight
6 2 (1.28%) Oracle ODI
6 2 (1.28%) Semantic Layer
6 2 (1.28%) SQL Server Integration Services
7 1 (0.64%) Parquet
7 1 (0.64%) SQL Server Analysis Services
7 1 (0.64%) SQL Server Reporting Services
Development Applications
1 16 (10.26%) Git
2 12 (7.69%) Jenkins
3 5 (3.21%) JIRA
4 2 (1.28%) Oracle APEX
5 1 (0.64%) CircleCI
5 1 (0.64%) GitLab
5 1 (0.64%) Gradle
5 1 (0.64%) Maven
5 1 (0.64%) Octopus Deploy
5 1 (0.64%) Vagrant
General
1 65 (41.67%) Social Skills
2 61 (39.10%) Finance
3 23 (14.74%) Analytical Skills
4 17 (10.90%) Law
5 15 (9.62%) Telecoms
6 13 (8.33%) Banking
7 11 (7.05%) Legal
8 10 (6.41%) Presentation Skills
9 6 (3.85%) Marketing
9 6 (3.85%) Retail
10 5 (3.21%) Front Office
10 5 (3.21%) Organisational Skills
11 4 (2.56%) Inclusion and Diversity
12 3 (1.92%) Games
13 2 (1.28%) Dutch Language
13 2 (1.28%) French Language
13 2 (1.28%) Influencing Skills
13 2 (1.28%) Investment Banking
13 2 (1.28%) Public Sector
14 1 (0.64%) Police
Job Titles
1 50 (32.05%) Senior
2 29 (18.59%) Azure Engineer
3 27 (17.31%) Architect
4 26 (16.67%) Cloud Engineer
5 16 (10.26%) Solutions Architect
6 15 (9.62%) Lead
7 14 (8.97%) Platform Engineer
7 14 (8.97%) Senior Cloud Engineer
8 12 (7.69%) Infrastructure Engineer
9 11 (7.05%) Developer
10 10 (6.41%) Consultant
11 8 (5.13%) Azure Platform Engineer
11 8 (5.13%) Cloud Platform Engineer
11 8 (5.13%) Data Architect
11 8 (5.13%) Infrastructure Consultant
11 8 (5.13%) Security Engineer
11 8 (5.13%) Senior Architect
11 8 (5.13%) Senior Consultant
11 8 (5.13%) Senior Infrastructure Consultant
12 7 (4.49%) Senior Platform Engineer
Libraries, Frameworks & Software Standards
1 19 (12.18%) .NET
2 11 (7.05%) Node.js
3 7 (4.49%) RESTful
4 5 (3.21%) Middleware
4 5 (3.21%) React
5 4 (2.56%) JSON
5 4 (2.56%) REST
5 4 (2.56%) YAML
6 3 (1.92%) .NET Framework
7 2 (1.28%) ARM Templates
7 2 (1.28%) Kafka
7 2 (1.28%) LAMP
7 2 (1.28%) LAPP Stack
7 2 (1.28%) MACH
7 2 (1.28%) SAML
7 2 (1.28%) SOAP
7 2 (1.28%) Spring Boot
7 2 (1.28%) Vue
8 1 (0.64%) .NET Core
8 1 (0.64%) GraphQL
Miscellaneous
1 25 (16.03%) Public Cloud
2 13 (8.33%) Cloud Native
2 13 (8.33%) Management Information System
3 9 (5.77%) Private Cloud
4 7 (4.49%) Replication
5 6 (3.85%) Clustering
5 6 (3.85%) Onboarding
6 5 (3.21%) Data Centre
6 5 (3.21%) Hybrid Cloud
7 4 (2.56%) Driving Licence
7 4 (2.56%) Enterprise Software
7 4 (2.56%) Security Posture
7 4 (2.56%) Virtual Team
8 3 (1.92%) Enterprise Cloud
8 3 (1.92%) Equities
8 3 (1.92%) Legacy Systems
9 2 (1.28%) Blog
9 2 (1.28%) Greenfield Project
9 2 (1.28%) Linux Command Line
9 2 (1.28%) PKI
Operating Systems
1 37 (23.72%) Windows
2 22 (14.10%) Linux
3 21 (13.46%) Windows Server
4 8 (5.13%) Android
4 8 (5.13%) Windows 10
5 6 (3.85%) Red Hat Enterprise Linux
5 6 (3.85%) Windows Server 2016
5 6 (3.85%) Windows Server 2019
6 4 (2.56%) Windows Server 2008
6 4 (2.56%) Windows Server 2012
7 3 (1.92%) Unix
8 1 (0.64%) CentOS
8 1 (0.64%) CoreOS
8 1 (0.64%) VMS
Processes & Methodologies
1 73 (46.79%) DevOps
2 59 (37.82%) CI/CD
3 46 (29.49%) Agile
4 34 (21.79%) Infrastructure as Code
5 26 (16.67%) Problem-Solving
6 21 (13.46%) Analytics
6 21 (13.46%) Computer Science
7 20 (12.82%) High Availability
7 20 (12.82%) Platform Engineering
8 19 (12.18%) Roadmaps
9 18 (11.54%) Test Automation
10 16 (10.26%) Cybersecurity
10 16 (10.26%) Project Delivery
11 15 (9.62%) Cloud Security
11 15 (9.62%) DevSecOps
11 15 (9.62%) Infrastructure Automation
11 15 (9.62%) Infrastructure Engineering
12 14 (8.97%) Microservices
12 14 (8.97%) Stakeholder Management
13 13 (8.33%) Migration
Programming Languages
1 41 (26.28%) Python
2 38 (24.36%) PowerShell
3 18 (11.54%) SQL
4 14 (8.97%) C#
5 10 (6.41%) Bash
6 9 (5.77%) JavaScript
7 6 (3.85%) Java
7 6 (3.85%) TypeScript
8 5 (3.21%) Bicep
9 3 (1.92%) Data Analysis Expressions
9 3 (1.92%) Go
10 2 (1.28%) C++
10 2 (1.28%) Ruby
11 1 (0.64%) C
11 1 (0.64%) F#
11 1 (0.64%) Haskell
11 1 (0.64%) Perl
11 1 (0.64%) PHP
11 1 (0.64%) Rust
11 1 (0.64%) SOQL
Qualifications
1 33 (21.15%) Degree
2 18 (11.54%) Azure Certification
3 14 (8.97%) Microsoft Certification
4 12 (7.69%) CCNA
4 12 (7.69%) Cisco Certification
5 8 (5.13%) Network+ Certification
6 7 (4.49%) SC Cleared
6 7 (4.49%) Security Cleared
7 6 (3.85%) AWS Certification
8 4 (2.56%) CCNP
8 4 (2.56%) Computer Science Degree
9 3 (1.92%) CISSP
9 3 (1.92%) Master's Degree
10 2 (1.28%) (ISC)2 CCSP
10 2 (1.28%) CCSP
10 2 (1.28%) CISA
10 2 (1.28%) GCED
10 2 (1.28%) GIAC
10 2 (1.28%) GREM
10 2 (1.28%) SANS
Quality Assurance & Compliance
1 10 (6.41%) ISO/IEC 27001
1 10 (6.41%) NIST
2 9 (5.77%) GDPR
3 4 (2.56%) NCSC
4 3 (1.92%) Cyber Essentials
4 3 (1.92%) Data Quality
4 3 (1.92%) GRC
5 2 (1.28%) Cyber Essentials PLUS
5 2 (1.28%) ISO/IEC 27002 (supersedes ISO/IEC 17799)
5 2 (1.28%) QA
System Software
1 31 (19.87%) VMware Infrastructure
2 22 (14.10%) Active Directory
3 17 (10.90%) Virtual Desktop
4 14 (8.97%) VMware ESXi
5 10 (6.41%) Hyper-V
6 7 (4.49%) Docker
7 3 (1.92%) Virtual Machines
8 2 (1.28%) KVM
8 2 (1.28%) Xen
Systems Management
1 36 (23.08%) Terraform
2 24 (15.38%) Kubernetes
3 20 (12.82%) Ansible
4 16 (10.26%) Microsoft Intune
5 8 (5.13%) SCCM
5 8 (5.13%) WSUS
6 5 (3.21%) Puppet
7 4 (2.56%) Progress Chef
8 2 (1.28%) Active Directory Federation Services
8 2 (1.28%) CFEngine
9 1 (0.64%) CASB
9 1 (0.64%) Consul
9 1 (0.64%) Grafana
9 1 (0.64%) Packer
9 1 (0.64%) Prometheus
9 1 (0.64%) Salt
9 1 (0.64%) Single Sign-On
Vendors
1 58 (37.18%) Microsoft
2 31 (19.87%) VMware
3 20 (12.82%) Cisco
4 18 (11.54%) Citrix
5 16 (10.26%) Databricks
6 12 (7.69%) Oracle
7 8 (5.13%) Veeam
8 6 (3.85%) EMC
8 6 (3.85%) Google
8 6 (3.85%) Red Hat
9 5 (3.21%) Palo Alto
10 4 (2.56%) ServiceNow
10 4 (2.56%) TOWER Software
11 3 (1.92%) Fortinet
11 3 (1.92%) Salesforce
11 3 (1.92%) SAP
12 2 (1.28%) Dell
12 2 (1.28%) F5
12 2 (1.28%) SonicWALL
12 2 (1.28%) Splunk