DevOps Jobs in the North of England

DevOps
England > North of England

The table below provides summary statistics for permanent job vacancies advertised in the North of England requiring DevOps skills. It includes a benchmarking guide to the annual salaries offered in vacancies that cited DevOps over the 6 months leading up to 17 May 2025, comparing them to the same period in the previous two years.

6 months to
17 May 2025
Same period 2024 Same period 2023
Rank 31 23 12
Rank change year-on-year -8 -11 -3
Permanent jobs citing DevOps 896 1,408 2,491
As % of all permanent jobs advertised in the North of England 7.64% 7.98% 14.68%
As % of the Processes & Methodologies category 8.04% 9.60% 15.16%
Number of salaries quoted 394 937 1,193
10th Percentile £41,250 £38,750 £41,500
25th Percentile £48,750 £48,250 £51,250
Median annual salary (50th Percentile) £67,500 £60,000 £61,500
Median % change year-on-year +12.50% -2.44% +2.50%
75th Percentile £84,688 £77,500 £77,715
90th Percentile £98,474 £91,934 £89,852
England median annual salary £72,000 £65,000 £70,000
% change year-on-year +10.77% -7.14% -

All Process and Methodology Skills
North of England

DevOps falls under the Processes and Methodologies category. For comparison with the information above, the following table provides summary statistics for all permanent job vacancies requiring process or methodology skills in the North of England.

Permanent vacancies with a requirement for process or methodology skills 11,141 14,663 16,436
As % of all permanent jobs advertised in the North of England 95.00% 83.15% 96.84%
Number of salaries quoted 5,753 11,257 7,869
10th Percentile £25,480 £27,500 £31,250
25th Percentile £38,500 £37,000 £40,000
Median annual salary (50th Percentile) £50,055 £50,000 £55,000
Median % change year-on-year +0.11% -9.09% +10.00%
75th Percentile £62,500 £65,000 £70,000
90th Percentile £77,500 £80,000 £82,500
England median annual salary £57,500 £55,000 £62,500
% change year-on-year +4.55% -12.00% +4.17%

DevOps
Job Vacancy Trend in the North of England

Job postings citing DevOps as a proportion of all IT jobs advertised in the North of England.
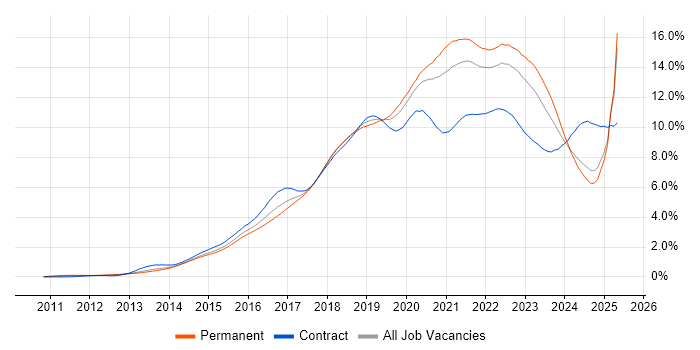
Job vacancy trend for DevOps in the North of England

DevOps
Salary Trend in the North of England

3-month moving average salary quoted in jobs citing DevOps in the North of England.

Salary trend for DevOps in the North of England

DevOps
Salary Histogram in the North of England

Salary distribution for jobs citing DevOps in the North of England over the 6 months to 17 May 2025.

Salary histogram for DevOps in the North of England

DevOps
Job Locations in the North of England

The table below looks at the demand and provides a guide to the median salaries quoted in IT jobs citing DevOps within the North of England region over the 6 months to 17 May 2025. The 'Rank Change' column provides an indication of the change in demand within each location based on the same 6 month period last year.

Location Rank Change
on Same Period
Last Year
Matching
Permanent
IT Job Ads
Median Salary
Past 6 Months
Median Salary
% Change
on Same Period
Last Year
Live
Jobs
North West -16 654 £69,384 +10.51% 398
Yorkshire -4 192 £68,000 +14.24% 239
North East +3 50 £65,000 +12.55% 83
DevOps
England

DevOps
Co-occurring Skills and Capabilities in the North of England by Category

The follow tables expand on the table above by listing co-occurrences grouped by category. The same employment type, locality and period is covered with up to 20 co-occurrences shown in each of the following categories:

Application Platforms
1 84 (9.38%) Confluence
2 15 (1.67%) Oracle Application Server
3 8 (0.89%) SharePoint
4 5 (0.56%) IIS
4 5 (0.56%) Microsoft Exchange
4 5 (0.56%) SAS
5 3 (0.33%) Adobe Experience Manager
5 3 (0.33%) Apache
5 3 (0.33%) CMS
5 3 (0.33%) nginx
6 2 (0.22%) Apache Airflow
6 2 (0.22%) Apache Spark
6 2 (0.22%) Oracle SOA Suite
7 1 (0.11%) Apache Solr
7 1 (0.11%) CICS
7 1 (0.11%) Headless CMS
7 1 (0.11%) Jupyter
7 1 (0.11%) OpenStack
7 1 (0.11%) Oracle Workflow
7 1 (0.11%) WebLogic
Applications
1 10 (1.12%) Microsoft Excel
2 6 (0.67%) Microsoft PowerPoint
2 6 (0.67%) MS Visio
3 4 (0.45%) Microsoft Office
4 2 (0.22%) Chatbot
4 2 (0.22%) Microsoft Project
Business Applications
1 3 (0.33%) Payment Gateway
2 2 (0.22%) Dynamics CRM
2 2 (0.22%) Oracle BPM
2 2 (0.22%) SAP Oil and Gas
3 1 (0.11%) Oracle EBS
3 1 (0.11%) Visualfiles
Cloud Services
1 380 (42.41%) Azure
2 309 (34.49%) AWS
3 142 (15.85%) GCP
4 102 (11.38%) Azure DevOps
5 44 (4.91%) GitHub
6 40 (4.46%) SaaS
7 31 (3.46%) Power Platform
8 27 (3.01%) Serverless
9 19 (2.12%) AWS CloudFormation
10 18 (2.01%) Cloud Computing
11 15 (1.67%) PaaS
12 14 (1.56%) Amazon ECS
12 14 (1.56%) AWS Lambda
12 14 (1.56%) Dynamics 365
12 14 (1.56%) Microsoft 365
13 13 (1.45%) Amazon EKS
13 13 (1.45%) GitHub Actions
13 13 (1.45%) Power Automate
14 12 (1.34%) Entra ID
14 12 (1.34%) IaaS
Communications & Networking
1 265 (29.58%) VPN
2 251 (28.01%) Cisco IOS
3 24 (2.68%) Firewall
4 17 (1.90%) TCP/IP
5 10 (1.12%) DNS
5 10 (1.12%) SAN
6 7 (0.78%) WAN
7 6 (0.67%) Multicast
8 5 (0.56%) SD-WAN
9 4 (0.45%) Broadband
9 4 (0.45%) HTTP
9 4 (0.45%) Network Security
10 3 (0.33%) FTP
10 3 (0.33%) HTTPS
10 3 (0.33%) Internet
10 3 (0.33%) Reverse Proxy
11 2 (0.22%) DHCP
11 2 (0.22%) LAN
11 2 (0.22%) SSH
11 2 (0.22%) SSL
Database & Business Intelligence
1 160 (17.86%) SQL Server
2 51 (5.69%) NoSQL
3 30 (3.35%) PostgreSQL
4 28 (3.13%) MySQL
5 24 (2.68%) MongoDB
6 23 (2.57%) Relational Database
7 21 (2.34%) Power BI
8 20 (2.23%) Data Warehouse
9 17 (1.90%) Oracle Reports
10 15 (1.67%) Enterprise Data Warehouse
11 11 (1.23%) Data Lake
12 9 (1.00%) Amazon RDS
12 9 (1.00%) RDBMS
12 9 (1.00%) Redis
13 8 (0.89%) Azure SQL Database
13 8 (0.89%) Elasticsearch
13 8 (0.89%) SQL Server Reporting Services
14 7 (0.78%) BigQuery
14 7 (0.78%) DB2
15 6 (0.67%) DynamoDB
Development Applications
1 168 (18.75%) JIRA
2 146 (16.29%) GitLab
3 134 (14.96%) SonarQube
4 128 (14.29%) Selenium
5 123 (13.73%) Cucumber
6 121 (13.50%) Sonatype Nexus
7 119 (13.28%) Maven
8 115 (12.83%) Bitbucket
9 72 (8.04%) Git
10 66 (7.37%) Jenkins
11 9 (1.00%) CircleCI
12 7 (0.78%) JUnit
13 6 (0.67%) JMeter
14 5 (0.56%) IBM UrbanCode
15 4 (0.45%) Balsamiq
15 4 (0.45%) Jaeger
15 4 (0.45%) NUnit
15 4 (0.45%) Robot Framework
15 4 (0.45%) TeamCity
16 3 (0.33%) Octopus Deploy
General
1 388 (43.30%) Inclusion and Diversity
2 308 (34.38%) Analytical Skills
3 286 (31.92%) Finance
4 208 (23.21%) Banking
5 177 (19.75%) Social Skills
6 88 (9.82%) Retail
7 72 (8.04%) Corporate Banking
7 72 (8.04%) Investment Banking
8 19 (2.12%) Law
8 19 (2.12%) Organisational Skills
9 15 (1.67%) Military
10 13 (1.45%) Legal
11 12 (1.34%) Marketing
12 11 (1.23%) Public Sector
13 9 (1.00%) Manufacturing
14 7 (0.78%) Games
14 7 (0.78%) Influencing Skills
14 7 (0.78%) Telecoms
15 6 (0.67%) Advertising
16 5 (0.56%) Financial Institution
Job Titles
1 270 (30.13%) Infrastructure Engineer
2 178 (19.87%) Software Engineer
3 110 (12.28%) Senior
4 103 (11.50%) Developer
5 90 (10.04%) Lead
6 60 (6.70%) DevOps Engineer
7 54 (6.03%) Architect
8 41 (4.58%) Cloud Engineer
9 40 (4.46%) Senior Developer
10 31 (3.46%) .NET Developer
11 26 (2.90%) Security Engineer
12 24 (2.68%) Solutions Architect
13 21 (2.34%) Senior Software Engineer
14 20 (2.23%) AWS Engineer
14 20 (2.23%) Azure Engineer
15 19 (2.12%) Technical Leader
16 18 (2.01%) Cloud Security Engineer
17 16 (1.79%) Senior DevOps
18 15 (1.67%) Software Manager
19 14 (1.56%) Senior .NET Developer
Libraries, Frameworks & Software Standards
1 262 (29.24%) Elastic Stack
2 169 (18.86%) React
3 144 (16.07%) Spring
4 138 (15.40%) Kafka
5 136 (15.18%) CSS
5 136 (15.18%) HTML
5 136 (15.18%) Spring Boot
6 121 (13.50%) .NET
7 113 (12.61%) Redux
8 112 (12.50%) JPA
9 98 (10.94%) REST
10 96 (10.71%) RESTful
11 78 (8.71%) Jest
11 78 (8.71%) Sass
12 77 (8.59%) HTML5
13 74 (8.26%) CSS3
14 51 (5.69%) .NET Core
15 49 (5.47%) Hibernate
16 44 (4.91%) AngularJS
17 36 (4.02%) Node.js
Miscellaneous
1 252 (28.13%) Cyberattack
2 176 (19.64%) Product Ownership
3 118 (13.17%) Enterprise Software
4 44 (4.91%) Cloud Native
5 26 (2.90%) Distributed Systems
6 23 (2.57%) Security Posture
7 17 (1.90%) Data Centre
7 17 (1.90%) Mobile App
7 17 (1.90%) Private Cloud
7 17 (1.90%) Public Cloud
8 16 (1.79%) Hybrid Cloud
8 16 (1.79%) Management Information System
9 15 (1.67%) Greenfield Project
10 9 (1.00%) Cloud Security Posture
10 9 (1.00%) Replication
11 7 (0.78%) Operational Technology
11 7 (0.78%) Renewable Energy
11 7 (0.78%) SCADA
12 6 (0.67%) Life Science
12 6 (0.67%) Linux Command Line
Operating Systems
1 320 (35.71%) Linux
2 298 (33.26%) Windows
3 252 (28.13%) Android
4 23 (2.57%) Unix
5 7 (0.78%) Red Hat Enterprise Linux
5 7 (0.78%) Windows 10
5 7 (0.78%) Windows Server
6 6 (0.67%) CentOS
6 6 (0.67%) Ubuntu
6 6 (0.67%) Windows Server 2012
6 6 (0.67%) Windows Server 2016
6 6 (0.67%) Windows Server 2019
7 3 (0.33%) Debian
8 2 (0.22%) AIX
8 2 (0.22%) Oracle Linux
8 2 (0.22%) zOS
9 1 (0.11%) VMS
Processes & Methodologies
1 387 (43.19%) Agile
2 367 (40.96%) Problem-Solving
3 357 (39.84%) CI/CD
4 284 (31.70%) Infrastructure Engineering
5 272 (30.36%) Risk Management
6 271 (30.25%) Line Management
7 267 (29.80%) Platform Engineering
8 264 (29.46%) Software Engineering
9 257 (28.68%) Task Automation
10 255 (28.46%) Mathematics
11 253 (28.24%) Storage Management
12 227 (25.33%) Microservices
13 226 (25.22%) Containerisation
14 183 (20.42%) Test Automation
15 172 (19.20%) Mentoring
16 163 (18.19%) SDLC
17 160 (17.86%) Full-Stack Development
18 135 (15.07%) Performance Optimisation
19 133 (14.84%) Continuous Improvement
20 124 (13.84%) Front End Development
Programming Languages
1 373 (41.63%) Python
2 293 (32.70%) PowerShell
3 284 (31.70%) Bash
4 233 (26.00%) Java
5 218 (24.33%) SQL
6 207 (23.10%) JavaScript
7 127 (14.17%) TypeScript
8 112 (12.50%) C#
9 21 (2.34%) Go
10 12 (1.34%) Bicep
11 10 (1.12%) PHP
11 10 (1.12%) T-SQL
12 8 (0.89%) Groovy
13 5 (0.56%) Perl
13 5 (0.56%) R
14 4 (0.45%) C
15 3 (0.33%) C++
15 3 (0.33%) Kotlin
15 3 (0.33%) PL/SQL
15 3 (0.33%) Scala
Qualifications
1 64 (7.14%) Degree
2 33 (3.68%) AWS Certification
3 32 (3.57%) Azure Certification
4 26 (2.90%) Security Cleared
5 21 (2.34%) DBS Check
5 21 (2.34%) SC Cleared
6 20 (2.23%) Computer Science Degree
7 11 (1.23%) AWS Certified Solutions Architect
8 9 (1.00%) AWS Certified Cloud Practitioner
8 9 (1.00%) Master's Degree
8 9 (1.00%) TOGAF Certification
9 6 (0.67%) Microsoft Certification
10 5 (0.56%) PhD
11 4 (0.45%) DV Cleared
11 4 (0.45%) Oracle Certification
12 3 (0.33%) Linux+ Certification
12 3 (0.33%) OCP
12 3 (0.33%) PMI Certification
12 3 (0.33%) RHCE
13 2 (0.22%) MBA
Quality Assurance & Compliance
1 154 (17.19%) QA
2 84 (9.38%) Accessibility
3 27 (3.01%) GDPR
4 13 (1.45%) NIST
5 12 (1.34%) HIPAA
5 12 (1.34%) ISO/IEC 27001
6 8 (0.89%) PCI DSS
7 7 (0.78%) Sarbanes-Oxley
8 5 (0.56%) Basel II
8 5 (0.56%) Basel III
8 5 (0.56%) Dodd-Frank
8 5 (0.56%) IFRS
8 5 (0.56%) IFRS 9
8 5 (0.56%) NCSC
8 5 (0.56%) SOC 2
9 3 (0.33%) Data Quality
10 1 (0.11%) ISO 20022
10 1 (0.11%) PMO
10 1 (0.11%) SLA
System Software
1 508 (56.70%) Docker
2 261 (29.13%) Hyper-V
3 255 (28.46%) vSphere
4 251 (28.01%) VMware NSX
5 18 (2.01%) Virtual Machines
6 11 (1.23%) Active Directory
7 8 (0.89%) VMware Infrastructure
8 5 (0.56%) Postfix
9 3 (0.33%) Dovecot
10 2 (0.22%) KVM
10 2 (0.22%) NFS
10 2 (0.22%) Sendmail
11 1 (0.11%) Oracle RAC
11 1 (0.11%) Squid
Systems Management
1 386 (43.08%) Terraform
2 298 (33.26%) Ansible
3 276 (30.80%) Kubernetes
4 26 (2.90%) Grafana
5 20 (2.23%) Prometheus
6 11 (1.23%) Istio
7 9 (1.00%) Argo
8 7 (0.78%) Puppet
9 6 (0.67%) AWS Copilot
10 5 (0.56%) Kibana
10 5 (0.56%) Progress Chef
11 4 (0.45%) Kustomize
11 4 (0.45%) Single Sign-On
12 3 (0.33%) Docker Swarm
13 2 (0.22%) Microsoft Intune
13 2 (0.22%) Nagios
13 2 (0.22%) Nessus
13 2 (0.22%) Salt
14 1 (0.11%) Control-M
14 1 (0.11%) Oracle RMAN
Vendors
1 259 (28.91%) Splunk
2 258 (28.79%) Cisco
3 252 (28.13%) Juniper
4 251 (28.01%) 3PAR
5 112 (12.50%) Solace
6 90 (10.04%) Microsoft
7 41 (4.58%) Google
8 37 (4.13%) Oracle
9 20 (2.23%) IBM
9 20 (2.23%) VMware
10 12 (1.34%) ServiceNow
11 8 (0.89%) Dynatrace
12 6 (0.67%) Databricks
12 6 (0.67%) SAP
13 5 (0.56%) Atlassian
13 5 (0.56%) Red Hat
14 4 (0.45%) Adobe
14 4 (0.45%) Hitachi
14 4 (0.45%) Meraki
15 3 (0.33%) New Relic