Law Jobs in the North of England

Law
England > North of England

The table below looks at the prevalence of the term Law in permanent job vacancies in the North of England. Included is a benchmarking guide to the salaries offered in vacancies that cited Law over the 6 months leading up to 21 May 2025, comparing them to the same period in the previous two years.

6 months to
21 May 2025
Same period 2024 Same period 2023
Rank 75 63 115
Rank change year-on-year -12 +52 -20
Permanent jobs citing Law 486 589 502
As % of all permanent jobs advertised in the North of England 4.15% 3.33% 2.97%
As % of the General category 5.86% 6.01% 4.23%
Number of salaries quoted 265 491 414
10th Percentile £26,000 £27,000 £31,250
25th Percentile £31,250 £36,250 £37,500
Median annual salary (50th Percentile) £50,000 £50,000 £50,000
Median % change year-on-year - - +11.11%
75th Percentile £67,500 £63,750 £60,000
90th Percentile £82,500 £72,500 £75,000
England median annual salary £55,000 £52,500 £52,500
% change year-on-year +4.76% - +5.00%

All General Skills
North of England

Law falls under the General Skills category. For comparison with the information above, the following table provides summary statistics for all permanent job vacancies requiring common skills in the North of England.

Permanent vacancies with a requirement for common skills 8,298 9,795 11,854
As % of all permanent jobs advertised in the North of England 70.90% 55.40% 70.16%
Number of salaries quoted 3,864 7,391 5,097
10th Percentile £25,087 £26,250 £28,500
25th Percentile £35,000 £33,750 £37,500
Median annual salary (50th Percentile) £50,055 £47,500 £52,180
Median % change year-on-year +5.38% -8.97% +4.36%
75th Percentile £62,085 £63,750 £67,500
90th Percentile £77,500 £76,250 £80,750
England median annual salary £56,500 £52,500 £60,000
% change year-on-year +7.62% -12.50% -

Law
Job Vacancy Trend in the North of England

Job postings citing Law as a proportion of all IT jobs advertised in the North of England.
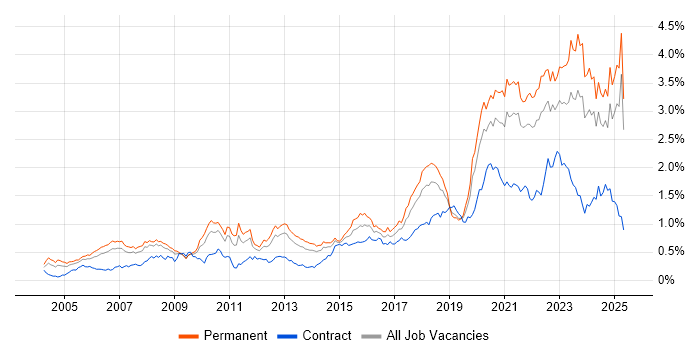
Job vacancy trend for Law in the North of England

Law
Salary Trend in the North of England

3-month moving average salary quoted in jobs citing Law in the North of England.

Salary trend for Law in the North of England

Law
Salary Histogram in the North of England

Salary distribution for jobs citing Law in the North of England over the 6 months to 21 May 2025.

Salary histogram for Law in the North of England

Law
Job Locations in the North of England

The table below looks at the demand and provides a guide to the median salaries quoted in IT jobs citing Law within the North of England region over the 6 months to 21 May 2025. The 'Rank Change' column provides an indication of the change in demand within each location based on the same 6 month period last year.

Location Rank Change
on Same Period
Last Year
Matching
Permanent
IT Job Ads
Median Salary
Past 6 Months
Median Salary
% Change
on Same Period
Last Year
Live
Jobs
North West -11 314 £60,000 +26.32% 178
Yorkshire +7 145 £42,500 -22.73% 111
North East +4 27 £39,250 -21.50% 28
Law
England

Law
Co-occurring Skills and Capabilities in the North of England by Category

The follow tables expand on the table above by listing co-occurrences grouped by category. The same employment type, locality and period is covered with up to 20 co-occurrences shown in each of the following categories:

Application Platforms
1 23 (4.73%) Confluence
1 23 (4.73%) SharePoint
2 3 (0.62%) SugarCRM
3 2 (0.41%) Apache
3 2 (0.41%) GemFire
Applications
1 7 (1.44%) Chatbot
1 7 (1.44%) Microsoft Office
2 5 (1.03%) Microsoft Excel
3 2 (0.41%) Microsoft PowerPoint
3 2 (0.41%) MS Visio
Business Applications
1 3 (0.62%) Dynamics CRM
1 3 (0.62%) Oracle ERP
2 2 (0.41%) Oracle Payables
2 2 (0.41%) Oracle Receivables
2 2 (0.41%) SAP S/4HANA
2 2 (0.41%) Visualfiles
3 1 (0.21%) Distributed Ledger
3 1 (0.21%) Oracle Financials
3 1 (0.21%) Oracle Payroll
Cloud Services
1 62 (12.76%) Azure
2 42 (8.64%) Microsoft 365
3 28 (5.76%) Power Platform
4 17 (3.50%) AWS
4 17 (3.50%) Dynamics 365
5 12 (2.47%) SaaS
6 8 (1.65%) Azure AKS
7 7 (1.44%) Entra ID
8 6 (1.23%) Microsoft Copilot
8 6 (1.23%) PowerApps
9 5 (1.03%) Power Automate
10 4 (0.82%) AWS CloudFormation
10 4 (0.82%) Azure DevOps
10 4 (0.82%) Azure Logic Apps
10 4 (0.82%) PaaS
10 4 (0.82%) Snowflake
11 3 (0.62%) Copilot Studio
11 3 (0.62%) OCI
12 2 (0.41%) Azure Cognitive Services
12 2 (0.41%) Azure Data Factory
Communications & Networking
1 19 (3.91%) Cisco IOS
2 13 (2.67%) Wireless
3 11 (2.26%) Firewall
4 4 (0.82%) WAN
5 3 (0.62%) DAB
5 3 (0.62%) LAN
6 2 (0.41%) Intranet
7 1 (0.21%) DHCP
7 1 (0.21%) DNS
7 1 (0.21%) Network Security
7 1 (0.21%) SD-WAN
7 1 (0.21%) WebEx
7 1 (0.21%) Wi-Fi
Database & Business Intelligence
1 13 (2.67%) Power BI
2 9 (1.85%) SQL Server
3 7 (1.44%) MongoDB
4 6 (1.23%) NoSQL
4 6 (1.23%) PostgreSQL
5 4 (0.82%) Data Lake
5 4 (0.82%) Data Warehouse
5 4 (0.82%) Elasticsearch
5 4 (0.82%) Tableau
6 2 (0.41%) Apache Ignite
6 2 (0.41%) InterSystems Cache
6 2 (0.41%) Oracle BI Publisher
6 2 (0.41%) Parquet
6 2 (0.41%) Power Query
6 2 (0.41%) RDBMS
6 2 (0.41%) Redis
6 2 (0.41%) Relational Database
7 1 (0.21%) MySQL
7 1 (0.21%) SQL Server Integration Services
7 1 (0.21%) SQL Server Reporting Services
Development Applications
1 29 (5.97%) JIRA
2 3 (0.62%) Babel
2 3 (0.62%) NUnit
2 3 (0.62%) webpack
3 2 (0.41%) Jenkins
3 2 (0.41%) MSTest
3 2 (0.41%) SpecFlow
3 2 (0.41%) TeamCity
4 1 (0.21%) CMake
4 1 (0.21%) Cypress.io
4 1 (0.21%) Git
4 1 (0.21%) Selenium
4 1 (0.21%) Storybook
General
1 229 (47.12%) Legal
2 179 (36.83%) Inclusion and Diversity
3 56 (11.52%) Social Skills
4 44 (9.05%) Finance
5 15 (3.09%) Analytical Skills
6 10 (2.06%) Presentation Skills
7 8 (1.65%) Financial Institution
7 8 (1.65%) Prime Brokerage
8 7 (1.44%) Influencing Skills
8 7 (1.44%) Retail
9 6 (1.23%) Manufacturing
10 5 (1.03%) Military
10 5 (1.03%) Online Betting
11 4 (0.82%) Front Office
11 4 (0.82%) Organisational Skills
11 4 (0.82%) Telecoms
12 3 (0.62%) Banking
12 3 (0.62%) Documentation Skills
13 2 (0.41%) Pharmaceutical
13 2 (0.41%) Public Sector
Job Titles
1 73 (15.02%) Analyst
2 47 (9.67%) Support Analyst
3 40 (8.23%) IT Analyst
4 38 (7.82%) IT Support
5 33 (6.79%) Developer
6 32 (6.58%) Consultant
6 32 (6.58%) IT Support Analyst
7 24 (4.94%) Lead
8 22 (4.53%) Senior
9 19 (3.91%) 2nd Line Support
9 19 (3.91%) Project Manager
10 18 (3.70%) 2nd Line Support Analyst
10 18 (3.70%) SQL Analyst
10 18 (3.70%) SQL Support Analyst
11 14 (2.88%) IT Manager
12 12 (2.47%) AWS Engineer
13 9 (1.85%) Security Engineer
14 8 (1.65%) Business Analyst
14 8 (1.65%) IT Project Manager
14 8 (1.65%) Risk Manager
Libraries, Frameworks & Software Standards
1 28 (5.76%) React
2 19 (3.91%) Node.js
3 15 (3.09%) .NET
4 12 (2.47%) Redux
5 11 (2.26%) Oracle Fusion
6 10 (2.06%) Bootstrap
6 10 (2.06%) CSS
6 10 (2.06%) HTML
7 9 (1.85%) RESTful
8 8 (1.65%) Spring
9 7 (1.44%) ASP.NET Web API
10 6 (1.23%) HTML5
10 6 (1.23%) JSON
11 5 (1.03%) REST
12 4 (0.82%) Saxon XSLT
12 4 (0.82%) Symfony
12 4 (0.82%) Vue
13 3 (0.62%) CSS3
13 3 (0.62%) GraphQL
13 3 (0.62%) Playwright
Miscellaneous
1 178 (36.63%) Cyberattack
2 12 (2.47%) Derivative
3 11 (2.26%) Life Science
4 10 (2.06%) Enterprise Cloud
4 10 (2.06%) Enterprise Software
5 9 (1.85%) Cloud Security Posture
5 9 (1.85%) Security Posture
6 8 (1.65%) Blockchain
6 8 (1.65%) Hedge funds
7 7 (1.44%) Data Protection Act
7 7 (1.44%) Product Ownership
8 6 (1.23%) Cyber Threat
9 4 (0.82%) Algorithms
9 4 (0.82%) Credit Derivative
9 4 (0.82%) Equities
9 4 (0.82%) Fixed Income
9 4 (0.82%) Foreign Exchange (FX)
9 4 (0.82%) Legacy Code
9 4 (0.82%) Self-Motivation
10 3 (0.62%) Legacy Systems
Operating Systems
1 38 (7.82%) Windows
2 28 (5.76%) Linux
3 19 (3.91%) Mac OS X
3 19 (3.91%) Windows 10
4 15 (3.09%) Windows Server
5 2 (0.41%) Unix
6 1 (0.21%) Android
6 1 (0.21%) Apple iOS
6 1 (0.21%) Windows Server 2016
6 1 (0.21%) Windows Server 2019
Processes & Methodologies
1 179 (36.83%) Line Management
2 177 (36.42%) Cybersecurity
3 174 (35.80%) Creative Thinking
4 79 (16.26%) Agile
5 41 (8.44%) Problem-Solving
6 40 (8.23%) Roadmaps
7 39 (8.02%) Project Management
8 36 (7.41%) Mentoring
9 27 (5.56%) Incident Management
10 26 (5.35%) ITSM
11 25 (5.14%) PRINCE2
12 23 (4.73%) Process Improvement
13 22 (4.53%) Artificial Intelligence
13 22 (4.53%) Software Engineering
14 21 (4.32%) Root Cause Analysis
15 20 (4.12%) Business Intelligence
15 20 (4.12%) Continuous Improvement
15 20 (4.12%) DevOps
15 20 (4.12%) Risk Management
15 20 (4.12%) Service Delivery
Programming Languages
1 49 (10.08%) SQL
2 25 (5.14%) JavaScript
3 21 (4.32%) Python
4 17 (3.50%) TypeScript
5 11 (2.26%) C#
6 10 (2.06%) Java
7 4 (0.82%) Go
7 4 (0.82%) PHP
8 3 (0.62%) C++
9 2 (0.41%) PowerShell
10 1 (0.21%) Kotlin
10 1 (0.21%) Swift
10 1 (0.21%) X++
Qualifications
1 30 (6.17%) Degree
2 27 (5.56%) Security Cleared
3 22 (4.53%) Microsoft Certification
4 11 (2.26%) CCNP
4 11 (2.26%) Cisco Certification
5 10 (2.06%) MCSA
6 9 (1.85%) AWS Certification
6 9 (1.85%) AWS Certified Cloud Practitioner
7 5 (1.03%) SC Cleared
8 4 (0.82%) Computer Science Degree
9 2 (0.41%) Azure Certification
9 2 (0.41%) ITIL Foundation Certificate
9 2 (0.41%) Master's Degree
9 2 (0.41%) SnowPro
10 1 (0.21%) APMG
10 1 (0.21%) BPSS Clearance
10 1 (0.21%) ISEB
10 1 (0.21%) MCSE
10 1 (0.21%) PRINCE2 Practitioner
Quality Assurance & Compliance
1 172 (35.39%) NCSC
2 21 (4.32%) GDPR
2 21 (4.32%) SLA
3 17 (3.50%) Cyber Essentials
4 11 (2.26%) ISO/IEC 27001
5 8 (1.65%) California Consumer Privacy Act
6 7 (1.44%) Accessibility
6 7 (1.44%) ISO 9001
7 6 (1.23%) ISO/IEC 27002 (supersedes ISO/IEC 17799)
7 6 (1.23%) QA
8 3 (0.62%) Data Quality
8 3 (0.62%) GRC
9 2 (0.41%) GLP
9 2 (0.41%) Good Clinical Practice
9 2 (0.41%) NIST
9 2 (0.41%) SOC 2
10 1 (0.21%) P3O
10 1 (0.21%) PERC
10 1 (0.21%) PMO
System Software
1 38 (7.82%) Active Directory
2 1 (0.21%) DFS Replication
2 1 (0.21%) Hyper-V
2 1 (0.21%) VMware Infrastructure
Systems Management
1 10 (2.06%) Microsoft Intune
2 9 (1.85%) Kubernetes
3 1 (0.21%) FortiGate
3 1 (0.21%) Prometheus
3 1 (0.21%) SCCM
Vendors
1 57 (11.73%) Microsoft
2 30 (6.17%) Cisco
3 21 (4.32%) Oracle
4 9 (1.85%) ServiceNow
5 6 (1.23%) VMware
6 5 (1.03%) Sage
6 5 (1.03%) Salesforce
6 5 (1.03%) SAP
7 4 (0.82%) Freshdesk
7 4 (0.82%) iManage
7 4 (0.82%) Workday
8 3 (0.62%) Intapp
9 2 (0.41%) Concur
9 2 (0.41%) Databricks
9 2 (0.41%) Facebook
9 2 (0.41%) OpenAI
9 2 (0.41%) Solace
9 2 (0.41%) TIBCO
10 1 (0.21%) Dynatrace
10 1 (0.21%) Meraki