Oracle Jobs in the North of England

Oracle
England > North of England

The table below provides summary statistics for permanent job vacancies advertised in the North of England requiring knowledge or experience of Oracle products and/or services. It includes a benchmarking guide to the annual salaries offered in vacancies that cited Oracle over the 6 months leading up to 18 May 2025, comparing them to the same period in the previous two years.

The figures below represent the IT labour market in general and are not representative of salaries within the Oracle Corporation.

6 months to
18 May 2025
Same period 2024 Same period 2023
Rank 155 96 89
Rank change year-on-year -59 -7 -36
Permanent jobs citing Oracle 236 465 653
As % of all permanent jobs advertised in the North of England 2.01% 2.63% 3.88%
As % of the Vendors category 5.37% 7.77% 8.28%
Number of salaries quoted 186 270 340
10th Percentile £40,750 £38,082 £38,225
25th Percentile £41,844 £47,231 £43,000
Median annual salary (50th Percentile) £57,500 £70,000 £52,500
Median % change year-on-year -17.86% +33.33% +5.00%
75th Percentile £67,500 £83,759 £67,750
90th Percentile £82,500 £90,000 £82,625
England median annual salary £62,500 £62,500 £61,376
% change year-on-year - +1.83% +6.74%

All Vendors
North of England

Oracle falls under the Vendor Products and Services category. For comparison with the information above, the following table provides summary statistics for all permanent job vacancies requiring knowledge or experience of all vendor products and services in the North of England.

Permanent vacancies with a requirement for knowledge or experience of vendor products and services 4,395 5,983 7,889
As % of all permanent jobs advertised in the North of England 37.36% 33.88% 46.84%
Number of salaries quoted 2,326 4,486 3,580
10th Percentile £24,000 £25,750 £27,750
25th Percentile £31,250 £32,125 £37,500
Median annual salary (50th Percentile) £47,500 £45,000 £50,000
Median % change year-on-year +5.56% -10.00% +11.11%
75th Percentile £58,943 £62,500 £65,000
90th Percentile £76,545 £77,715 £77,542
England median annual salary £55,000 £50,000 £57,106
% change year-on-year +10.00% -12.44% +3.83%

Oracle
Job Vacancy Trend in the North of England

Job postings citing Oracle as a proportion of all IT jobs advertised in the North of England.
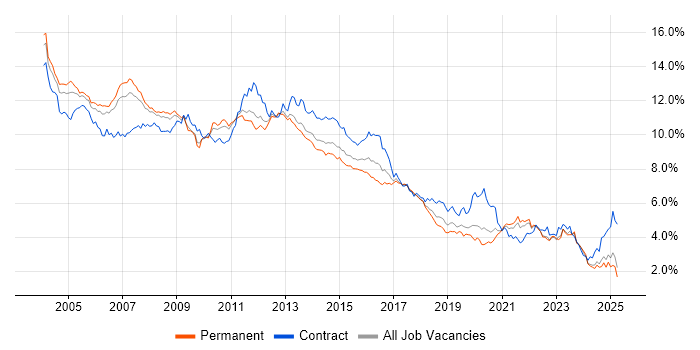
Job vacancy trend for Oracle in the North of England

Oracle
Salary Trend in the North of England

3-month moving average salary quoted in jobs citing Oracle in the North of England.

Salary trend for Oracle in the North of England

Oracle
Salary Histogram in the North of England

Salary distribution for jobs citing Oracle in the North of England over the 6 months to 18 May 2025.

Salary histogram for Oracle in the North of England

Oracle
Job Locations in the North of England

The table below looks at the demand and provides a guide to the median salaries quoted in IT jobs citing Oracle within the North of England region over the 6 months to 18 May 2025. The 'Rank Change' column provides an indication of the change in demand within each location based on the same 6 month period last year.

Location Rank Change
on Same Period
Last Year
Matching
Permanent
IT Job Ads
Median Salary
Past 6 Months
Median Salary
% Change
on Same Period
Last Year
Live
Jobs
North West -59 165 £55,000 -25.48% 106
Yorkshire -27 51 £62,500 -15.32% 72
North East -1 18 £65,000 +23.81% 19
Oracle
England

Oracle
Co-occurring Skills and Capabilities in the North of England by Category

The follow tables expand on the table above by listing co-occurrences grouped by category. The same employment type, locality and period is covered with up to 20 co-occurrences shown in each of the following categories:

Application Platforms
1 15 (6.36%) Oracle Application Server
2 6 (2.54%) Apache
3 5 (2.12%) Confluence
4 4 (1.69%) Apache Spark
4 4 (1.69%) SAS
5 3 (1.27%) GemFire
5 3 (1.27%) SharePoint
5 3 (1.27%) Tomcat
6 2 (0.85%) Oracle SOA Suite
6 2 (0.85%) WebSphere
6 2 (0.85%) WebSphere Application Server
7 1 (0.42%) IIS
7 1 (0.42%) Oracle Workflow
7 1 (0.42%) WebLogic
Applications
1 6 (2.54%) Microsoft Excel
2 5 (2.12%) Microsoft Office
3 1 (0.42%) Microsoft PowerPoint
3 1 (0.42%) Spreadsheet
Business Applications
1 8 (3.39%) SAP BPC
2 6 (2.54%) Infor LN
2 6 (2.54%) Oracle EBS
3 5 (2.12%) NetSuite
4 4 (1.69%) Oracle ERP
5 2 (0.85%) Oracle BPM
5 2 (0.85%) Oracle Payables
5 2 (0.85%) Oracle Receivables
5 2 (0.85%) Payment Gateway
5 2 (0.85%) SAP Oil and Gas
6 1 (0.42%) Infor M3
6 1 (0.42%) Infor SunSystems
6 1 (0.42%) iTrent
6 1 (0.42%) Oracle Applications
6 1 (0.42%) Oracle Assets
6 1 (0.42%) Oracle Financials
6 1 (0.42%) Oracle Payroll
6 1 (0.42%) SAP S/4HANA
Cloud Services
1 40 (16.95%) Azure
2 29 (12.29%) AWS
3 24 (10.17%) OCI
4 22 (9.32%) GCP
5 13 (5.51%) Microsoft 365
6 12 (5.08%) SaaS
7 6 (2.54%) GitHub
8 2 (0.85%) Power Platform
9 1 (0.42%) Amazon S3
9 1 (0.42%) IaaS
9 1 (0.42%) PaaS
9 1 (0.42%) Power Automate
9 1 (0.42%) PowerApps
9 1 (0.42%) Virtual Private Cloud
9 1 (0.42%) Workato
Communications & Networking
1 9 (3.81%) DNS
2 8 (3.39%) SAN
3 7 (2.97%) DHCP
3 7 (2.97%) NAS
4 6 (2.54%) LAN
5 5 (2.12%) Firewall
5 5 (2.12%) VSAN
6 4 (1.69%) Wireless
7 3 (1.27%) HTTPS
7 3 (1.27%) VPN
8 2 (0.85%) FCoE
8 2 (0.85%) Fibre Channel
8 2 (0.85%) FTP
8 2 (0.85%) HTTP
8 2 (0.85%) Intranet
8 2 (0.85%) iSCSI
8 2 (0.85%) Multicast
8 2 (0.85%) SSH
8 2 (0.85%) SSL
8 2 (0.85%) WAN
Database & Business Intelligence
1 49 (20.76%) SQL Server
2 27 (11.44%) Oracle Reports
3 21 (8.90%) Data Warehouse
4 15 (6.36%) Enterprise Data Warehouse
5 13 (5.51%) MongoDB
6 12 (5.08%) Oracle Database
7 11 (4.66%) MySQL
8 8 (3.39%) Tableau
9 7 (2.97%) PostgreSQL
10 6 (2.54%) NoSQL
10 6 (2.54%) Oracle BI Publisher
11 5 (2.12%) Relational Database
12 4 (1.69%) RDBMS
13 3 (1.27%) Apache Ignite
13 3 (1.27%) InterSystems Cache
13 3 (1.27%) Oracle ODI
13 3 (1.27%) Redis
14 2 (0.85%) Hadoop
14 2 (0.85%) Oracle Database 11g
14 2 (0.85%) Oracle Database 12c
Development Applications
1 18 (7.63%) Oracle Forms
2 11 (4.66%) Git
3 8 (3.39%) Jenkins
4 7 (2.97%) JIRA
5 6 (2.54%) Selenium
6 5 (2.12%) ClearCase
6 5 (2.12%) Rational DOORS
7 4 (1.69%) Appium
7 4 (1.69%) Fiddler
7 4 (1.69%) JMeter
7 4 (1.69%) LoadRunner
7 4 (1.69%) Postman
8 2 (0.85%) GitLab
8 2 (0.85%) JDeveloper
8 2 (0.85%) Sonatype Nexus
9 1 (0.42%) Liquibase
General
1 84 (35.59%) Finance
2 63 (26.69%) Social Skills
3 45 (19.07%) Analytical Skills
4 32 (13.56%) Aerospace
5 21 (8.90%) Law
6 20 (8.47%) Organisational Skills
7 18 (7.63%) Banking
7 18 (7.63%) Military
7 18 (7.63%) Retail
8 17 (7.20%) Manufacturing
9 9 (3.81%) Inclusion and Diversity
10 8 (3.39%) Police
11 7 (2.97%) Public Sector
12 5 (2.12%) Cantonese Language
12 5 (2.12%) Legal
12 5 (2.12%) Marketing
13 4 (1.69%) Financial Institution
13 4 (1.69%) Mandarin Language
13 4 (1.69%) Multimedia
14 3 (1.27%) Telecoms
Job Titles
1 51 (21.61%) Lead
2 37 (15.68%) Developer
3 29 (12.29%) Software Developer
4 27 (11.44%) Analyst
5 25 (10.59%) Architect
6 24 (10.17%) Senior
7 12 (5.08%) Applications Support
7 12 (5.08%) Software Engineer
8 11 (4.66%) Support Analyst
8 11 (4.66%) Systems Analyst
9 10 (4.24%) Cloud Architect
9 10 (4.24%) Financial Analyst
9 10 (4.24%) Solutions Architect
10 9 (3.81%) Administrator
10 9 (3.81%) Applications Support Analyst
10 9 (3.81%) Infrastructure Architect
10 9 (3.81%) Team Leader
11 8 (3.39%) Cloud Engineer
11 8 (3.39%) Consultant
11 8 (3.39%) Finance Systems Analyst
Libraries, Frameworks & Software Standards
1 20 (8.47%) Oracle Fusion
2 15 (6.36%) Middleware
3 12 (5.08%) XML
4 9 (3.81%) Kafka
5 8 (3.39%) .NET
5 8 (3.39%) React
6 6 (2.54%) Express.js
6 6 (2.54%) Node.js
6 6 (2.54%) SOAP
7 5 (2.12%) XSD
8 4 (1.69%) JSON
8 4 (1.69%) LDAP
9 3 (1.27%) HTML
9 3 (1.27%) RabbitMQ
9 3 (1.27%) Spring
10 2 (0.85%) CSS
10 2 (0.85%) EDI
10 2 (0.85%) LAMP
10 2 (0.85%) Oracle ADF
10 2 (0.85%) Software Packaging
Miscellaneous
1 43 (18.22%) Management Information System
2 12 (5.08%) Operational Technology
3 11 (4.66%) Cloud Native
4 9 (3.81%) Data Centre
4 9 (3.81%) Manufacturing Execution System
5 8 (3.39%) Hybrid Cloud
5 8 (3.39%) Product Ownership
6 7 (2.97%) SCADA
7 6 (2.54%) Distributed Systems
8 5 (2.12%) Data Structures
9 4 (1.69%) Algorithms
9 4 (1.69%) Life Science
9 4 (1.69%) Replication
9 4 (1.69%) Self-Motivation
9 4 (1.69%) Virtual Team
10 3 (1.27%) Client/Server
10 3 (1.27%) Derivative
10 3 (1.27%) Pricing Data
11 2 (0.85%) FMCG
11 2 (0.85%) Foreign Exchange (FX)
Operating Systems
1 43 (18.22%) Linux
2 30 (12.71%) Windows
3 7 (2.97%) Unix
4 6 (2.54%) Oracle Linux
4 6 (2.54%) Red Hat Enterprise Linux
5 4 (1.69%) Mac OS X
5 4 (1.69%) Solaris
6 2 (0.85%) AIX
6 2 (0.85%) CentOS
6 2 (0.85%) Windows Server
Processes & Methodologies
1 84 (35.59%) Agile
2 78 (33.05%) Problem-Solving
3 58 (24.58%) ITIL
4 49 (20.76%) Continuous Improvement
5 43 (18.22%) Business Analysis
6 42 (17.80%) Software Engineering
7 39 (16.53%) SDLC
8 37 (15.68%) DevOps
8 37 (15.68%) OO
8 37 (15.68%) Software Testing
9 34 (14.41%) Architectural Design
9 34 (14.41%) OOP
9 34 (14.41%) Service Delivery
10 33 (13.98%) Collaborative Culture
11 30 (12.71%) Analytics
12 29 (12.29%) Systems Thinking
13 25 (10.59%) Information Management
14 24 (10.17%) CI/CD
15 22 (9.32%) ERP
16 21 (8.90%) Data Management
Programming Languages
1 86 (36.44%) SQL
2 76 (32.20%) Java
3 37 (15.68%) C#
4 28 (11.86%) Python
5 15 (6.36%) PL/SQL
6 12 (5.08%) JavaScript
6 12 (5.08%) Shell Script
7 11 (4.66%) Korn
8 9 (3.81%) C-shell
9 6 (2.54%) TypeScript
10 4 (1.69%) PowerShell
10 4 (1.69%) Scala
11 2 (0.85%) AWK
11 2 (0.85%) C
11 2 (0.85%) C++
11 2 (0.85%) Perl
11 2 (0.85%) PHP
11 2 (0.85%) VBA
12 1 (0.42%) ActionScript
12 1 (0.42%) VB
Qualifications
1 81 (34.32%) Degree
2 17 (7.20%) BPSS Clearance
2 17 (7.20%) Security Cleared
3 15 (6.36%) DBS Check
4 13 (5.51%) Computer Science Degree
4 13 (5.51%) TOGAF Certification
5 9 (3.81%) PhD
6 7 (2.97%) SC Cleared
7 6 (2.54%) ACCA
7 6 (2.54%) Azure Certification
7 6 (2.54%) CIMA
8 5 (2.12%) HNC
8 5 (2.12%) HND
8 5 (2.12%) Microsoft Certification
8 5 (2.12%) VMware Certified Professional (VCP)
9 4 (1.69%) ISTQB
10 2 (0.85%) AWS Certification
10 2 (0.85%) ITIL Foundation Certificate
11 1 (0.42%) DV Cleared
11 1 (0.42%) Postgraduate
Quality Assurance & Compliance
1 7 (2.97%) QA
2 6 (2.54%) GAAP
2 6 (2.54%) IFRS
3 3 (1.27%) Data Quality
4 2 (0.85%) Accessibility
5 1 (0.42%) GDPR
5 1 (0.42%) PCI DSS
5 1 (0.42%) PMO
System Software
1 7 (2.97%) Docker
2 6 (2.54%) Active Directory
3 5 (2.12%) VMware NSX
4 4 (1.69%) Hyper-V
4 4 (1.69%) KVM
5 2 (0.85%) NFS
5 2 (0.85%) Postfix
5 2 (0.85%) Sendmail
5 2 (0.85%) SRDF
5 2 (0.85%) Veritas Cluster Server
5 2 (0.85%) VMware Infrastructure
5 2 (0.85%) Xen
6 1 (0.42%) Oracle RAC
Systems Management
1 17 (7.20%) Terraform
2 13 (5.51%) Kubernetes
3 12 (5.08%) Ansible
4 6 (2.54%) Puppet
5 5 (2.12%) Progress Chef
6 2 (0.85%) Grafana
6 2 (0.85%) Microsoft Data Protection Manager
6 2 (0.85%) Microsoft Intune
6 2 (0.85%) Nagios
6 2 (0.85%) Nessus
6 2 (0.85%) NetBackup
6 2 (0.85%) Oracle RMAN
6 2 (0.85%) SCCM
6 2 (0.85%) SCOM
6 2 (0.85%) WSUS
Vendors
1 29 (12.29%) Microsoft
2 26 (11.02%) SAP
3 17 (7.20%) VMware
4 11 (4.66%) Red Hat
5 9 (3.81%) IBM
6 8 (3.39%) Concur
6 8 (3.39%) Google
7 6 (2.54%) Cognos
7 6 (2.54%) Infor
7 6 (2.54%) Workday
8 4 (1.69%) Apple
8 4 (1.69%) Cisco
8 4 (1.69%) JD Edwards
9 3 (1.27%) Databricks
9 3 (1.27%) Palantir
9 3 (1.27%) Solace
9 3 (1.27%) TIBCO
10 2 (0.85%) Broadcom
10 2 (0.85%) ServiceNow
10 2 (0.85%) Tenable