SQL Server Jobs in the North of England

Microsoft SQL Server (MS SQL)
England > North of England

The table below provides summary statistics for permanent job vacancies advertised in the North of England requiring SQL Server skills. It includes a benchmarking guide to the annual salaries offered in vacancies that cited SQL Server over the 6 months leading up to 18 May 2025, comparing them to the same period in the previous two years.

6 months to
18 May 2025
Same period 2024 Same period 2023
Rank 78 31 71
Rank change year-on-year -47 +40 -38
Permanent jobs citing SQL Server 461 970 823
As % of all permanent jobs advertised in the North of England 3.92% 5.49% 4.89%
As % of the Database & Business Intelligence category 37.97% 31.27% 23.73%
Number of salaries quoted 312 888 658
10th Percentile £31,250 £31,874 £32,500
25th Percentile £37,500 £40,000 £40,000
Median annual salary (50th Percentile) £50,000 £50,000 £50,000
Median % change year-on-year - - +11.11%
75th Percentile £62,500 £63,750 £61,063
90th Percentile £71,250 £78,250 £76,625
England median annual salary £55,000 £55,000 £57,000
% change year-on-year - -3.51% +3.64%

All Database and Business Intelligence Skills
North of England

SQL Server falls under the Databases and Business Intelligence category. For comparison with the information above, the following table provides summary statistics for all permanent job vacancies requiring database or business intelligence skills in the North of England.

Permanent vacancies with a requirement for database or business intelligence skills 1,214 3,102 3,468
As % of all permanent jobs advertised in the North of England 10.32% 17.56% 20.59%
Number of salaries quoted 829 2,295 1,783
10th Percentile £31,250 £31,250 £34,723
25th Percentile £41,000 £40,000 £41,114
Median annual salary (50th Percentile) £55,000 £50,000 £54,882
Median % change year-on-year +10.00% -8.90% +9.76%
75th Percentile £71,250 £65,603 £70,000
90th Percentile £82,751 £82,875 £80,000
England median annual salary £62,500 £57,500 £65,000
% change year-on-year +8.70% -11.54% +8.33%

SQL Server
Job Vacancy Trend in the North of England

Job postings citing SQL Server as a proportion of all IT jobs advertised in the North of England.
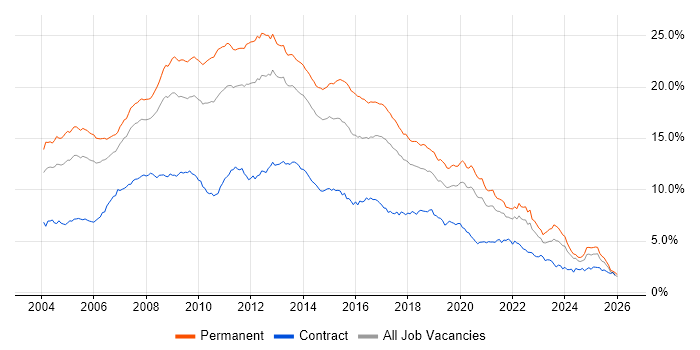
Job vacancy trend for SQL Server in the North of England

SQL Server
Salary Trend in the North of England

3-month moving average salary quoted in jobs citing SQL Server in the North of England.

Salary trend for SQL Server in the North of England

SQL Server
Salary Histogram in the North of England

Salary distribution for jobs citing SQL Server in the North of England over the 6 months to 18 May 2025.

Salary histogram for SQL Server in the North of England

SQL Server
Job Locations in the North of England

The table below looks at the demand and provides a guide to the median salaries quoted in IT jobs citing SQL Server within the North of England region over the 6 months to 18 May 2025. The 'Rank Change' column provides an indication of the change in demand within each location based on the same 6 month period last year.

Location Rank Change
on Same Period
Last Year
Matching
Permanent
IT Job Ads
Median Salary
Past 6 Months
Median Salary
% Change
on Same Period
Last Year
Live
Jobs
North West -65 292 £50,000 - 164
Yorkshire -16 139 £52,500 +5.00% 65
North East -17 34 £51,250 +7.89% 26
SQL Server
England

SQL Server
Co-occurring Skills and Capabilities in the North of England by Category

The follow tables expand on the table above by listing co-occurrences grouped by category. The same employment type, locality and period is covered with up to 20 co-occurrences shown in each of the following categories:

Application Platforms
1 49 (10.63%) Confluence
2 19 (4.12%) CMS
2 19 (4.12%) Umbraco
3 17 (3.69%) IIS
4 6 (1.30%) Microsoft Exchange
5 3 (0.65%) SAS
5 3 (0.65%) Tomcat
6 2 (0.43%) Apache Airflow
6 2 (0.43%) SharePoint
6 2 (0.43%) WebSphere
6 2 (0.43%) WebSphere Application Server
7 1 (0.22%) Apache
7 1 (0.22%) Apache Spark
7 1 (0.22%) OpenEdge
Applications
1 9 (1.95%) Microsoft Office
2 5 (1.08%) Microsoft Excel
3 1 (0.22%) Adobe XD
3 1 (0.22%) Chatbot
3 1 (0.22%) Spreadsheet
Business Applications
1 2 (0.43%) Dynamics NAV
1 2 (0.43%) Payment Gateway
2 1 (0.22%) Dynamics CRM
2 1 (0.22%) iTrent
2 1 (0.22%) Oracle EBS
2 1 (0.22%) Sage 200
2 1 (0.22%) SystmOne
Cloud Services
1 281 (60.95%) Azure
2 178 (38.61%) AWS
3 57 (12.36%) GCP
4 39 (8.46%) Power Platform
5 36 (7.81%) SaaS
6 26 (5.64%) GitHub
7 16 (3.47%) Microsoft 365
8 12 (2.60%) Azure DevOps
9 10 (2.17%) Azure Data Factory
10 7 (1.52%) Serverless
11 6 (1.30%) Azure Cosmos DB
11 6 (1.30%) Azure Functions
12 5 (1.08%) Azure Service Bus
12 5 (1.08%) IaaS
12 5 (1.08%) PaaS
13 4 (0.87%) Azure Logic Apps
13 4 (0.87%) Azure Stack
13 4 (0.87%) Entra ID
13 4 (0.87%) Power Automate
14 3 (0.65%) Firebase
Communications & Networking
1 22 (4.77%) SAN
2 19 (4.12%) Intranet
3 15 (3.25%) DNS
3 15 (3.25%) Firewall
4 10 (2.17%) DHCP
5 9 (1.95%) NAS
6 8 (1.74%) Multicast
7 7 (1.52%) TCP/IP
7 7 (1.52%) VPN
8 5 (1.08%) VSAN
9 2 (0.43%) Cisco Nexus
9 2 (0.43%) DMZ
9 2 (0.43%) FCoE
9 2 (0.43%) Fibre Channel
9 2 (0.43%) IP Telephony
9 2 (0.43%) iSCSI
9 2 (0.43%) LAN
9 2 (0.43%) WAN
9 2 (0.43%) Wireless
10 1 (0.22%) VLAN
Database & Business Intelligence
1 39 (8.46%) Power BI
2 30 (6.51%) MongoDB
3 26 (5.64%) MySQL
3 26 (5.64%) PostgreSQL
4 25 (5.42%) SQL Server Reporting Services
5 20 (4.34%) Data Warehouse
5 20 (4.34%) NoSQL
6 14 (3.04%) SQL Server Integration Services
7 11 (2.39%) SQL Server Analysis Services
8 10 (2.17%) Relational Database
9 9 (1.95%) Azure SQL Database
10 7 (1.52%) Big Data
10 7 (1.52%) DB2
11 6 (1.30%) Data Lake
11 6 (1.30%) Oracle Database
12 4 (0.87%) Biml
12 4 (0.87%) Data Hub
12 4 (0.87%) Metadata
12 4 (0.87%) SQL CLR
12 4 (0.87%) SQLite
Development Applications
1 127 (27.55%) JIRA
2 117 (25.38%) Selenium
3 114 (24.73%) Bitbucket
3 114 (24.73%) GitLab
3 114 (24.73%) SonarQube
3 114 (24.73%) Sonatype Nexus
4 113 (24.51%) Maven
5 112 (24.30%) Cucumber
6 34 (7.38%) Git
7 11 (2.39%) TeamCity
7 11 (2.39%) Visual Studio
8 10 (2.17%) Octopus Deploy
9 7 (1.52%) SQL Server Management Studio (SSMS)
10 5 (1.08%) NUnit
10 5 (1.08%) Oracle Forms
11 4 (0.87%) Jenkins
12 3 (0.65%) JMeter
13 2 (0.43%) Artifactory
13 2 (0.43%) SpecFlow
13 2 (0.43%) Team Foundation Server
General
1 160 (34.71%) Finance
2 121 (26.25%) Banking
3 112 (24.30%) Inclusion and Diversity
4 101 (21.91%) Social Skills
5 98 (21.26%) Retail
6 72 (15.62%) Corporate Banking
6 72 (15.62%) Investment Banking
7 26 (5.64%) Analytical Skills
8 18 (3.90%) Manufacturing
9 17 (3.69%) Organisational Skills
10 10 (2.17%) Back Office
11 9 (1.95%) Law
12 8 (1.74%) Advertising
13 6 (1.30%) Marketing
13 6 (1.30%) Public Sector
14 5 (1.08%) Legal
15 4 (0.87%) Automotive
15 4 (0.87%) Local Government
16 3 (0.65%) Electronics
17 1 (0.22%) Telecoms
Job Titles
1 192 (41.65%) Developer
2 142 (30.80%) Software Engineer
3 59 (12.80%) Senior
4 47 (10.20%) Software Developer
4 47 (10.20%) SQL Developer
5 36 (7.81%) .NET Developer
6 27 (5.86%) Senior Developer
6 27 (5.86%) Support Engineer
7 26 (5.64%) Database Developer
8 22 (4.77%) IT Engineer
8 22 (4.77%) SQL Database Developer
9 20 (4.34%) C# Developer
9 20 (4.34%) IT Support
10 19 (4.12%) Umbraco Developer
11 18 (3.90%) IT Support Engineer
12 16 (3.47%) Data Engineer
12 16 (3.47%) Software Support Engineer
13 15 (3.25%) Analyst
14 14 (3.04%) Cloud Engineer
14 14 (3.04%) Senior Software Engineer
Libraries, Frameworks & Software Standards
1 173 (37.53%) CSS
2 166 (36.01%) HTML
3 152 (32.97%) React
4 122 (26.46%) Kafka
5 117 (25.38%) .NET
6 113 (24.51%) Spring Boot
7 112 (24.30%) JPA
7 112 (24.30%) Redux
7 112 (24.30%) Spring
8 97 (21.04%) HTML5
9 90 (19.52%) RESTful
10 82 (17.79%) REST
11 78 (16.92%) CSS3
12 77 (16.70%) Sass
13 73 (15.84%) Jest
14 52 (11.28%) .NET Core
15 45 (9.76%) ASP.NET
16 40 (8.68%) Hibernate
17 36 (7.81%) .NET Framework
18 30 (6.51%) AngularJS
Miscellaneous
1 117 (25.38%) Product Ownership
2 115 (24.95%) Enterprise Software
3 30 (6.51%) Management Information System
4 27 (5.86%) Mobile App
5 20 (4.34%) NHS
6 18 (3.90%) Self-Motivation
7 8 (1.74%) Hybrid Cloud
7 8 (1.74%) Legacy Systems
7 8 (1.74%) Replication
8 6 (1.30%) Greenfield Project
8 6 (1.30%) Team-Oriented Environment
9 5 (1.08%) Clustering
9 5 (1.08%) Enterprise Storage
10 4 (0.87%) Distributed Systems
10 4 (0.87%) Hedge funds
10 4 (0.87%) Private Cloud
11 3 (0.65%) Data Centre
11 3 (0.65%) Driving Licence
11 3 (0.65%) Enterprise Cloud
11 3 (0.65%) Onboarding
Operating Systems
1 57 (12.36%) Windows
2 26 (5.64%) Linux
3 20 (4.34%) Android
4 12 (2.60%) Windows Server
5 10 (2.17%) Windows 10
6 9 (1.95%) Windows Server 2012
6 9 (1.95%) Windows Server 2016
7 7 (1.52%) Windows Server 2019
8 5 (1.08%) Unix
9 4 (0.87%) Apple iOS
10 3 (0.65%) Solaris
11 2 (0.43%) Debian
11 2 (0.43%) Windows Server 2008
12 1 (0.22%) Mac OS
12 1 (0.22%) Ubuntu
Processes & Methodologies
1 236 (51.19%) Agile
2 188 (40.78%) Software Engineering
3 160 (34.71%) DevOps
4 155 (33.62%) CI/CD
5 139 (30.15%) Containerisation
6 138 (29.93%) Performance Optimisation
7 137 (29.72%) Full-Stack Development
8 136 (29.50%) Problem-Solving
9 131 (28.42%) Microservices
10 129 (27.98%) SDLC
11 122 (26.46%) Test Automation
12 114 (24.73%) Front End Development
13 107 (23.21%) Migration
14 105 (22.78%) Mentoring
15 85 (18.44%) User Experience
16 77 (16.70%) Clean Code
17 73 (15.84%) Responsive Web Design
17 73 (15.84%) Strategic Thinking
18 65 (14.10%) Continuous Improvement
19 57 (12.36%) TDD
Programming Languages
1 296 (64.21%) SQL
2 171 (37.09%) JavaScript
3 168 (36.44%) Java
4 158 (34.27%) C#
5 88 (19.09%) TypeScript
6 62 (13.45%) T-SQL
7 30 (6.51%) Python
8 19 (4.12%) PHP
9 17 (3.69%) PowerShell
10 9 (1.95%) C++
11 7 (1.52%) Bicep
12 5 (1.08%) Bash
12 5 (1.08%) VB.NET
13 4 (0.87%) Data Analysis Expressions
14 3 (0.65%) Shell Script
15 2 (0.43%) VB
15 2 (0.43%) VBScript
16 1 (0.22%) ActionScript
16 1 (0.22%) C
16 1 (0.22%) VBA
Qualifications
1 92 (19.96%) Degree
2 36 (7.81%) DBS Check
3 17 (3.69%) Computer Science Degree
4 14 (3.04%) Azure Certification
5 12 (2.60%) Microsoft Certification
6 7 (1.52%) Security Cleared
7 6 (1.30%) SC Cleared
7 6 (1.30%) VMware Certified Professional (VCP)
8 3 (0.65%) AWS Certification
8 3 (0.65%) HND
8 3 (0.65%) ITIL Certification
9 2 (0.43%) CISM
9 2 (0.43%) CISSP
9 2 (0.43%) CompTIA Security+
9 2 (0.43%) MCITP
9 2 (0.43%) MCSE
9 2 (0.43%) TOGAF Certification
10 1 (0.22%) BPSS Clearance
10 1 (0.22%) Postgraduate
Quality Assurance & Compliance
1 127 (27.55%) QA
2 92 (19.96%) Accessibility
3 22 (4.77%) GDPR
4 19 (4.12%) WCAG
5 7 (1.52%) Data Quality
6 6 (1.30%) ISO 9001
7 3 (0.65%) PCI DSS
8 2 (0.43%) Cyber Essentials
8 2 (0.43%) ISO/IEC 27001
8 2 (0.43%) NCSC
8 2 (0.43%) NIST
8 2 (0.43%) SLA
System Software
1 132 (28.63%) Docker
2 20 (4.34%) Active Directory
3 14 (3.04%) VMware Infrastructure
4 12 (2.60%) Hyper-V
5 6 (1.30%) vSphere
6 5 (1.08%) VMware NSX
7 4 (0.87%) Virtual Machines
8 3 (0.65%) VMware ESXi
9 2 (0.43%) KVM
9 2 (0.43%) NFS
9 2 (0.43%) SRDF
9 2 (0.43%) Veritas Cluster Server
9 2 (0.43%) Xen
10 1 (0.22%) Apache Flume
10 1 (0.22%) HDFS
10 1 (0.22%) pfSense
Systems Management
1 130 (28.20%) Kubernetes
2 21 (4.56%) Terraform
3 10 (2.17%) Ansible
4 9 (1.95%) Microsoft Intune
5 5 (1.08%) Progress Chef
6 4 (0.87%) Grafana
7 3 (0.65%) Docker Swarm
7 3 (0.65%) Failover Clustering
7 3 (0.65%) SCCM
7 3 (0.65%) vCenter Server
8 2 (0.43%) Active Directory Federation Services
8 2 (0.43%) Puppet
9 1 (0.22%) Control-M
9 1 (0.22%) Kibana
9 1 (0.22%) logstash
9 1 (0.22%) NetBackup
9 1 (0.22%) Oozie
9 1 (0.22%) Oracle RMAN
Vendors
1 146 (31.67%) Microsoft
2 112 (24.30%) Solace
3 49 (10.63%) Oracle
4 23 (4.99%) VMware
5 21 (4.56%) HP
6 16 (3.47%) Zoho
7 12 (2.60%) Cisco
8 8 (1.74%) Google
8 8 (1.74%) IBM
9 6 (1.30%) Databricks
9 6 (1.30%) SAP
10 5 (1.08%) EMC
10 5 (1.08%) ServiceNow
10 5 (1.08%) Splunk
10 5 (1.08%) Veeam
11 4 (0.87%) Nimble Storage
11 4 (0.87%) Sage
12 2 (0.43%) Avaya
12 2 (0.43%) ESET
12 2 (0.43%) Intapp