Data Munging Jobs with Work from Home Options

Data Munging (Data Wrangling)
UK > Work from Home

The table below provides summary statistics for permanent job vacancies with an option to work from home (WFH) and a requirement for Data Munging skills. Included is a benchmarking guide to the salaries offered in vacancies that have cited Data Munging over the 6 months to 23 April 2024 with a comparison to the same period in the previous 2 years.

6 months to
23 Apr 2024
Same period 2023 Same period 2022
Rank 557 622 702
Rank change year-on-year +65 +80 -211
Permanent jobs citing Data Munging 36 52 130
As % of all permanent jobs with a WFH option 0.11% 0.12% 0.20%
As % of the Processes & Methodologies category 0.12% 0.12% 0.20%
Number of salaries quoted 12 14 61
10th Percentile £33,375 - £47,500
25th Percentile £41,250 £40,532 £52,500
Median annual salary (50th Percentile) £51,853 £55,000 £65,000
Median % change year-on-year -5.72% -15.38% -3.70%
75th Percentile £68,125 £58,750 £82,500
90th Percentile £70,000 £81,750 £100,000
UK median annual salary £57,500 £55,000 £60,875
% change year-on-year +4.55% -9.65% -6.35%

All Process and Methodology Skills
Work from Home

Data Munging is in the Processes and Methodologies category. The following table is for comparison with the above and provides summary statistics for all permanent job vacancies with a WFH option and a requirement for process or methodology skills.

Permanent vacancies with a requirement for process or methodology skills 31,002 41,964 64,515
As % of all permanent jobs with a WFH option 91.76% 96.07% 96.85%
Number of salaries quoted 23,617 29,021 41,200
10th Percentile £33,750 £37,500 £36,250
25th Percentile £42,500 £47,500 £45,000
Median annual salary (50th Percentile) £57,500 £62,500 £60,000
Median % change year-on-year -8.00% +4.17% +9.09%
75th Percentile £75,000 £82,500 £80,000
90th Percentile £95,000 £100,000 £95,000
UK median annual salary £55,000 £61,600 £60,000
% change year-on-year -10.71% +2.67% +9.09%

Data Munging
Trend for Jobs with a WFH Option

Job vacancies with a work from home option citing Data Munging as a proportion of all IT jobs advertised.
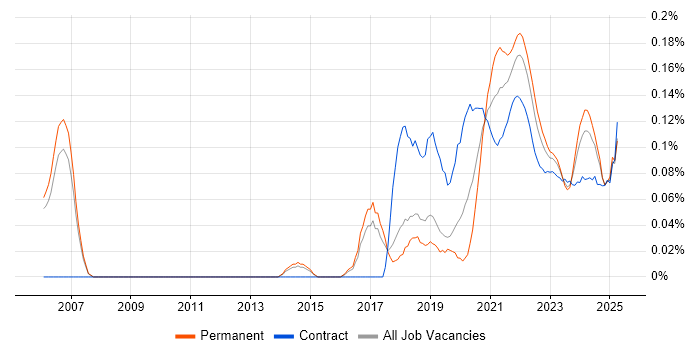
Data Munging trend for jobs with a WFH option

Data Munging
Salary Trend for Jobs with a WFH Option

3-month moving average salary quoted in job vacancies with a work from home option citing Data Munging.

Data Munging salary trend for jobs with a WFH option

Data Munging
Salary Histogram for Jobs with a WFH Option

Salary distribution for jobs with a work from home option citing Data Munging over the 6 months to 23 April 2024.

Data Munging salary histogram for jobs with a WFH option

Data Munging
Co-occurring Skills and Capabilities with WFH Options by Category

The follow tables expand on the table above by listing co-occurrences grouped by category. The same employment type, locality and period is covered with up to 20 co-occurrences shown in each of the following categories:

Application Platforms
1 2 (5.56%) SharePoint
2 1 (2.78%) Apache Spark
Applications
1 2 (5.56%) Microsoft Excel
1 2 (5.56%) Microsoft Office
Cloud Services
1 10 (27.78%) Power Platform
2 8 (22.22%) Azure
3 5 (13.89%) AWS
3 5 (13.89%) Snowflake
4 2 (5.56%) Azure DevOps
4 2 (5.56%) Dynamics 365
4 2 (5.56%) Microsoft 365
4 2 (5.56%) Power Automate
4 2 (5.56%) PowerApps
5 1 (2.78%) Amazon EMR
5 1 (2.78%) Amazon Kinesis
5 1 (2.78%) GCP
Communications & Networking
1 2 (5.56%) SSH
Database & Business Intelligence
1 22 (61.11%) Tableau
2 10 (27.78%) Power BI
3 2 (5.56%) Azure SQL Database
3 2 (5.56%) BusinessObjects
3 2 (5.56%) NoSQL
3 2 (5.56%) SQL Server Integration Services
4 1 (2.78%) Amazon Athena
4 1 (2.78%) Amazon Redshift
4 1 (2.78%) Big Data
4 1 (2.78%) BigQuery
4 1 (2.78%) Data Warehouse
4 1 (2.78%) DynamoDB
4 1 (2.78%) Electronic Patient Records
4 1 (2.78%) Looker
4 1 (2.78%) Neo4j
Development Applications
1 23 (63.89%) Git
2 1 (2.78%) Jenkins
2 1 (2.78%) Spinnaker
General
1 29 (80.56%) Social Skills
2 6 (16.67%) Analytical Skills
3 4 (11.11%) Banking
3 4 (11.11%) Finance
3 4 (11.11%) Inclusion and Diversity
3 4 (11.11%) Presentation Skills
4 3 (8.33%) Multimedia
5 2 (5.56%) Organisational Skills
6 1 (2.78%) Local Government
6 1 (2.78%) Tech for Good
Job Titles
1 25 (69.44%) Senior
2 20 (55.56%) Data Scientist
2 20 (55.56%) Senior Data Scientist
3 7 (19.44%) Analyst
4 5 (13.89%) Data Analyst
5 4 (11.11%) Financial Analyst
5 4 (11.11%) Service Analyst
6 2 (5.56%) Applications Developer
6 2 (5.56%) Developer
6 2 (5.56%) IT Support
6 2 (5.56%) Power Apps Developer
6 2 (5.56%) Senior Analyst
7 1 (2.78%) AWS Data Engineer
7 1 (2.78%) AWS Engineer
7 1 (2.78%) Data Engineer
7 1 (2.78%) Site Engineer
7 1 (2.78%) Site Reliability Engineer
Libraries, Frameworks & Software Standards
1 20 (55.56%) Pandas
1 20 (55.56%) PySpark
1 20 (55.56%) scikit-learn
1 20 (55.56%) TensorFlow
2 2 (5.56%) HTML5 Canvas
2 2 (5.56%) JSON
3 1 (2.78%) Kafka
3 1 (2.78%) Spark Streaming
Miscellaneous
1 20 (55.56%) Algorithms
2 3 (8.33%) Social Media
2 3 (8.33%) Taxonomies
3 2 (5.56%) Data Structures
3 2 (5.56%) Linux Command Line
3 2 (5.56%) Wiki
4 1 (2.78%) Distributed Systems
4 1 (2.78%) Management Information System
Operating Systems
1 2 (5.56%) Windows
2 1 (2.78%) Linux
Processes & Methodologies
1 26 (72.22%) Machine Learning
2 25 (69.44%) Statistics
3 23 (63.89%) Storytelling
4 22 (61.11%) Actionable Insight
4 22 (61.11%) Data Science
5 21 (58.33%) Artificial Intelligence
5 21 (58.33%) Visualisation
6 20 (55.56%) Customer Experience
6 20 (55.56%) Decision-Making
6 20 (55.56%) Demand Forecasting
6 20 (55.56%) Generative AI
6 20 (55.56%) Mathematics
6 20 (55.56%) MLOps
6 20 (55.56%) Natural Language Processing
6 20 (55.56%) Neural Network
6 20 (55.56%) Physics
6 20 (55.56%) Predictive Modelling
6 20 (55.56%) Propensity Modelling
6 20 (55.56%) Root Cause Analysis
6 20 (55.56%) WFM
Programming Languages
1 32 (88.89%) SQL
2 29 (80.56%) Python
3 4 (11.11%) R
3 4 (11.11%) T-SQL
4 2 (5.56%) Bash
4 2 (5.56%) PowerShell
5 1 (2.78%) Java
5 1 (2.78%) Scala
Qualifications
1 23 (63.89%) Degree
2 22 (61.11%) DBS Check
3 20 (55.56%) Master's Degree
Quality Assurance & Compliance
1 8 (22.22%) Data Quality
2 1 (2.78%) QA
Systems Management
1 1 (2.78%) Ansible
1 1 (2.78%) Terraform
Vendors
1 23 (63.89%) Databricks
2 8 (22.22%) Alteryx
3 4 (11.11%) Microsoft
4 2 (5.56%) Blue Prism
4 2 (5.56%) Oracle
4 2 (5.56%) SAP
5 1 (2.78%) Cloudera
5 1 (2.78%) Google
5 1 (2.78%) Hortonworks