Actionable Recommendations Jobs with Work from Home Options

Actionable Recommendations
UK > Work from Home

The table below provides summary statistics for permanent job vacancies with an option to work from home (WFH) and a requirement for Actionable Recommendations skills. Included is a benchmarking guide to the salaries offered in vacancies that have cited Actionable Recommendations over the 6 months to 7 May 2024 with a comparison to the same period in the previous 2 years.

6 months to
7 May 2024
Same period 2023 Same period 2022
Rank 538 614 775
Rank change year-on-year +76 +161 -224
Permanent jobs citing Actionable Recommendations 48 49 77
As % of all permanent jobs with a WFH option 0.14% 0.12% 0.11%
As % of the Quality Assurance & Compliance category 1.13% 0.80% 0.71%
Number of salaries quoted 37 16 11
10th Percentile £29,750 - £40,000
25th Percentile £31,000 £34,723 £46,750
Median annual salary (50th Percentile) £47,029 £51,250 £50,500
Median % change year-on-year -8.24% +1.49% +12.22%
75th Percentile £52,500 £57,931 £71,250
90th Percentile £68,500 - £85,000
UK median annual salary £50,000 £52,500 £67,500
% change year-on-year -4.76% -22.22% +12.50%

All Quality Assurance and Compliance Skills
Work from Home

Actionable Recommendations is in the Quality Assurance and Compliance category. The following table is for comparison with the above and provides summary statistics for all permanent job vacancies with a WFH option and a requirement for quality assurance or compliance skills.

Permanent vacancies with a requirement for quality assurance or compliance skills 4,251 6,097 10,919
As % of all permanent jobs with a WFH option 12.63% 14.66% 15.89%
Number of salaries quoted 3,229 4,124 6,033
10th Percentile £34,750 £36,250 £32,500
25th Percentile £42,500 £46,250 £42,500
Median annual salary (50th Percentile) £57,500 £60,000 £55,000
Median % change year-on-year -4.17% +9.09% +4.76%
75th Percentile £73,750 £77,500 £73,750
90th Percentile £95,000 £92,500 £90,000
UK median annual salary £52,500 £57,500 £55,000
% change year-on-year -8.70% +4.55% +3.77%

Actionable Recommendations
Trend for Jobs with a WFH Option

Job vacancies with a work from home option citing Actionable Recommendations as a proportion of all IT jobs advertised.
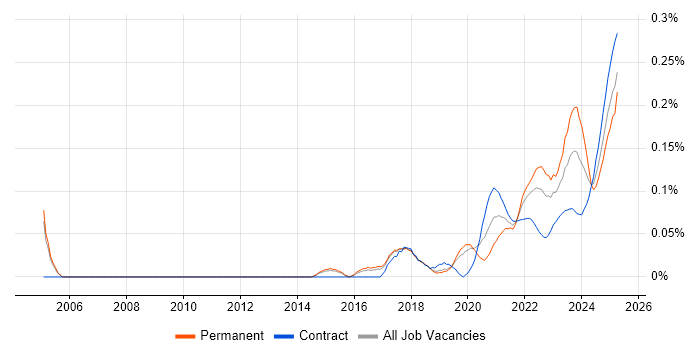
Actionable Recommendations trend for jobs with a WFH option

Actionable Recommendations
Salary Trend for Jobs with a WFH Option

3-month moving average salary quoted in job vacancies with a work from home option citing Actionable Recommendations.

Actionable Recommendations salary trend for jobs with a WFH option

Actionable Recommendations
Salary Histogram for Jobs with a WFH Option

Salary distribution for jobs with a work from home option citing Actionable Recommendations over the 6 months to 7 May 2024.

Actionable Recommendations salary histogram for jobs with a WFH option

Actionable Recommendations
Co-occurring Skills and Capabilities with WFH Options by Category

The follow tables expand on the table above by listing co-occurrences grouped by category. The same employment type, locality and period is covered with up to 20 co-occurrences shown in each of the following categories:

Application Platforms
1 2 (4.17%) SAS
Applications
1 6 (12.50%) InVision
1 6 (12.50%) Sketch
2 3 (6.25%) Microsoft Excel
2 3 (6.25%) Microsoft Office
3 2 (4.17%) EViews
3 2 (4.17%) SPSS
Business Applications
1 1 (2.08%) Magento
Cloud Services
1 8 (16.67%) Power Platform
2 6 (12.50%) Microsoft 365
3 5 (10.42%) Power Automate
4 4 (8.33%) SaaS
5 3 (6.25%) Google Analytics
6 1 (2.08%) Google Tag Manager
Communications & Networking
1 6 (12.50%) Firewall
1 6 (12.50%) Intranet
1 6 (12.50%) Wireless
Database & Business Intelligence
1 8 (16.67%) Power BI
2 6 (12.50%) Data Warehouse
3 2 (4.17%) Data Hub
3 2 (4.17%) QlikView
General
1 19 (39.58%) Finance
2 13 (27.08%) Presentation Skills
3 12 (25.00%) Marketing
3 12 (25.00%) Social Skills
4 7 (14.58%) Analytical Skills
5 6 (12.50%) Public Sector
6 4 (8.33%) Banking
7 2 (4.17%) Advertising
7 2 (4.17%) Local Government
7 2 (4.17%) Publishing
7 2 (4.17%) Retail
Job Titles
1 18 (37.50%) Analyst
2 9 (18.75%) Senior
2 9 (18.75%) User Researcher
3 6 (12.50%) Penetration Tester
3 6 (12.50%) Security Penetration Tester
3 6 (12.50%) Security Tester
3 6 (12.50%) Senior Penetration Tester
3 6 (12.50%) Senior Tester
3 6 (12.50%) Tester
4 5 (10.42%) Business Intelligence Manager
4 5 (10.42%) Business Manager
4 5 (10.42%) Data Analyst
4 5 (10.42%) Financial Analyst
5 3 (6.25%) Asset Management Analyst
5 3 (6.25%) Software Analyst
5 3 (6.25%) Software Licensing Analyst
6 2 (4.17%) Analytics Consultant
6 2 (4.17%) Junior Consultant
6 2 (4.17%) Senior Analyst
6 2 (4.17%) Senior Data Analyst
Libraries, Frameworks & Software Standards
1 5 (10.42%) Flash
Miscellaneous
1 6 (12.50%) NHS
1 6 (12.50%) Product Ownership
2 4 (8.33%) Social Media
3 3 (6.25%) Microsoft Licensing
4 2 (4.17%) Credit Risk
4 2 (4.17%) Podcast
Processes & Methodologies
1 48 (100.00%) Actionable Insight
2 22 (45.83%) Decision-Making
3 16 (33.33%) Problem-Solving
4 11 (22.92%) Customer Requirements
4 11 (22.92%) Economics
5 10 (20.83%) Analytics
5 10 (20.83%) Cybersecurity
6 9 (18.75%) Agile
6 9 (18.75%) Psychology
6 9 (18.75%) Qualitative Research
6 9 (18.75%) Quantitative Research
6 9 (18.75%) Statistics
6 9 (18.75%) Translating Business Requirements
6 9 (18.75%) Usability Testing
6 9 (18.75%) User Research
7 8 (16.67%) Business Intelligence
7 8 (16.67%) Data Analysis
7 8 (16.67%) Statistical Analysis
8 7 (14.58%) Penetration Testing
8 7 (14.58%) User Stories
Programming Languages
1 9 (18.75%) Python
2 8 (16.67%) SQL
3 5 (10.42%) VB
4 4 (8.33%) R
5 2 (4.17%) MATLAB
6 1 (2.08%) C++
Qualifications
1 25 (52.08%) Degree
2 7 (14.58%) CREST Certified
3 6 (12.50%) CHECK Team Leader
3 6 (12.50%) CHECK Team Member
3 6 (12.50%) Cyber Scheme
3 6 (12.50%) OSCP
3 6 (12.50%) PCI QSA
3 6 (12.50%) Tigerscheme
4 2 (4.17%) Master's Degree
5 1 (2.08%) ACCA
5 1 (2.08%) CCSAS
5 1 (2.08%) CIMA
Quality Assurance & Compliance
1 9 (18.75%) Accessibility
2 6 (12.50%) GRC
2 6 (12.50%) NIST
2 6 (12.50%) PCI DSS
Vendors
1 9 (18.75%) Adobe
1 9 (18.75%) Microsoft
2 6 (12.50%) Hotjar
3 5 (10.42%) Dell
3 5 (10.42%) SAP
4 3 (6.25%) Apple
4 3 (6.25%) Google
4 3 (6.25%) IBM
4 3 (6.25%) Oracle
5 2 (4.17%) HubSpot
5 2 (4.17%) Salesforce