Data Engineer Jobs with Work from Home Options

Data Engineer
UK > Work from Home

The median Data Engineer salary in Work from Home is £65,000 per year according to job vacancies posted during the 6 months to 28 April 2024.

The first table below provides salary benchmarking and summary statistics including a comparison to same period in the previous 2 years.

6 months to
28 Apr 2024
Same period 2023 Same period 2022
Rank 174 118 160
Rank change year-on-year -56 +42 +40
Permanent jobs requiring a Data Engineer 623 1,213 1,665
As % of all permanent jobs with a WFH option 1.85% 2.84% 2.49%
As % of the Job Titles category 1.92% 2.95% 2.56%
Number of salaries quoted 557 841 945
10th Percentile £37,230 £45,000 £46,250
25th Percentile £48,000 £56,000 £52,500
Median annual salary (50th Percentile) £65,000 £69,447 £70,000
Median % change year-on-year -6.40% -0.79% +12.00%
75th Percentile £82,500 £93,750 £85,000
90th Percentile £97,500 £130,000 £96,250
UK median annual salary £65,000 £70,000 £68,823
% change year-on-year -7.14% +1.71% +14.71%

All Permanent IT Job Vacancies
Work from Home

The following table is for comparison with the above and includes summary statistics for all permanent IT job vacancies with a WFH option. Most job vacancies include a discernible job title that can be normalized. As such, the figures in the second row provide an indication of the number of permanent jobs in our overall sample.

Permanent vacancies in Work from Home with a recognized job title 32,398 41,102 65,163
% of permanent jobs with a recognized job title 95.97% 96.07% 97.40%
Number of salaries quoted 24,874 29,219 41,983
10th Percentile £33,000 £36,500 £36,033
25th Percentile £42,500 £47,250 £45,000
Median annual salary (50th Percentile) £56,000 £62,500 £60,000
Median % change year-on-year -10.40% +4.17% +9.09%
75th Percentile £75,000 £81,250 £80,000
90th Percentile £92,500 £100,000 £95,000
UK median annual salary £52,550 £60,000 £60,000
% change year-on-year -12.42% - +9.09%

Data Engineer
Trend for Jobs with a WFH Option

Job vacancies with a work from home option which featured Data Engineer in the job title as a proportion of all IT jobs advertised.
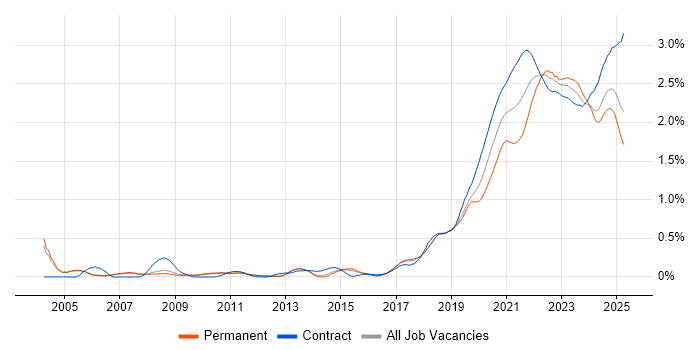
Data Engineer trend for jobs with a WFH option

Data Engineer
Salary Trend for Jobs with a WFH Option

3-month moving average salary quoted in job vacancies with a work from home option citing Data Engineer.

Data Engineer salary trend for jobs with a WFH option

Data Engineer
Salary Histogram for Jobs with a WFH Option

Salary distribution for jobs with a work from home option citing Data Engineer over the 6 months to 28 April 2024.

Data Engineer salary histogram for jobs with a WFH option

Data Engineer Skill Set
Top 30 Co-occurring Skills and Capabilities in Job Vacancies with WFH Options

For the 6 months to 28 April 2024, Data Engineer job roles required the following skills and capabilities in order of popularity. The figures indicate the absolute number co-occurrences and as a proportion of all permanent jobs with remote work options featuring Data Engineer in the job title.

1 407 (65.33%) Python
2 393 (63.08%) SQL
3 309 (49.60%) Azure
4 303 (48.64%) ETL
5 274 (43.98%) Data Engineering
6 212 (34.03%) Data Warehouse
7 207 (33.23%) Data Pipeline
8 202 (32.42%) Analytics
9 195 (31.30%) Data Modelling
9 195 (31.30%) AWS
10 153 (24.56%) Data Lake
11 152 (24.40%) Social Skills
12 148 (23.76%) Databricks
12 148 (23.76%) Data Science
13 137 (21.99%) Business Intelligence
14 134 (21.51%) CI/CD
15 133 (21.35%) Agile
16 125 (20.06%) Power Platform
16 125 (20.06%) Power BI
16 125 (20.06%) GCP
17 122 (19.58%) SQL Server
18 120 (19.26%) Data Quality
19 119 (19.10%) Data Integration
20 112 (17.98%) Machine Learning
21 111 (17.82%) Finance
22 105 (16.85%) Snowflake
23 103 (16.53%) DevOps
24 95 (15.25%) Azure Data Factory
25 83 (13.32%) Problem-Solving
26 78 (12.52%) Microsoft

Data Engineer Skill Set
Co-occurring Skills and Capabilities with WFH Options by Category

The follow tables expand on the table above by listing co-occurrences grouped by category. The same employment type, locality and period is covered with up to 20 co-occurrences shown in each of the following categories:

Application Platforms
1 61 (9.79%) Apache Airflow
2 58 (9.31%) Apache Spark
3 45 (7.22%) Apache
4 11 (1.77%) Confluence
5 3 (0.48%) SharePoint
6 1 (0.16%) ArcGIS
6 1 (0.16%) Luigi
6 1 (0.16%) nginx
Applications
1 6 (0.96%) Microsoft Office
2 3 (0.48%) AutoCAD
2 3 (0.48%) Microsoft Excel
2 3 (0.48%) Microsoft PowerPoint
Business Applications
1 2 (0.32%) MIS ActiveH
1 2 (0.32%) NEC Housing
2 1 (0.16%) Salesforce CRM
2 1 (0.16%) SAP S/4HANA
2 1 (0.16%) Shopify
Cloud Services
1 309 (49.60%) Azure
2 195 (31.30%) AWS
3 125 (20.06%) GCP
3 125 (20.06%) Power Platform
4 105 (16.85%) Snowflake
5 95 (15.25%) Azure Data Factory
6 72 (11.56%) Azure Synapse Analytics
7 71 (11.40%) dbt
8 53 (8.51%) Amazon S3
9 42 (6.74%) Azure Cosmos DB
10 40 (6.42%) Azure DevOps
11 39 (6.26%) Serverless
12 32 (5.14%) Matillion
13 31 (4.98%) SaaS
14 24 (3.85%) AWS Lambda
15 23 (3.69%) GitHub
16 19 (3.05%) Amazon Kinesis
17 9 (1.44%) Azure Data Lake Analytics
17 9 (1.44%) Microsoft Purview
18 8 (1.28%) Prefect
Communications & Networking
1 9 (1.44%) Network Security
2 4 (0.64%) Firewall
3 1 (0.16%) LAN
3 1 (0.16%) VPN
3 1 (0.16%) WAN
3 1 (0.16%) WebEx
Database & Business Intelligence
1 212 (34.03%) Data Warehouse
2 153 (24.56%) Data Lake
3 125 (20.06%) Power BI
4 122 (19.58%) SQL Server
5 72 (11.56%) BigQuery
6 58 (9.31%) Amazon Redshift
7 46 (7.38%) Tableau
8 45 (7.22%) Big Data
9 43 (6.90%) NoSQL
10 42 (6.74%) PostgreSQL
11 39 (6.26%) SQL Server Integration Services
12 36 (5.78%) Star Schema
13 32 (5.14%) Hadoop
14 31 (4.98%) Elasticsearch
15 28 (4.49%) Azure SQL Database
16 22 (3.53%) Data Mining
16 22 (3.53%) Relational Database
17 21 (3.37%) MySQL
18 19 (3.05%) Delta Lake
19 18 (2.89%) SQL Server Reporting Services
Development Applications
1 39 (6.26%) Git
2 37 (5.94%) GitLab
3 27 (4.33%) Jenkins
4 13 (2.09%) JIRA
5 9 (1.44%) MLflow
6 7 (1.12%) Spinnaker
7 4 (0.64%) Bitbucket
7 4 (0.64%) CircleCI
8 3 (0.48%) Deequ
8 3 (0.48%) Octopus Deploy
8 3 (0.48%) Team Foundation Server
8 3 (0.48%) TeamCity
8 3 (0.48%) Visual Studio
9 2 (0.32%) JUnit
9 2 (0.32%) MSTest
9 2 (0.32%) NUnit
9 2 (0.32%) Oracle Forms
General
1 152 (24.40%) Social Skills
2 111 (17.82%) Finance
3 48 (7.70%) Banking
4 45 (7.22%) Retail
5 34 (5.46%) Analytical Skills
6 28 (4.49%) Games
7 23 (3.69%) Public Sector
8 22 (3.53%) Legal
8 22 (3.53%) Marketing
9 20 (3.21%) Law
10 16 (2.57%) Inclusion and Diversity
11 6 (0.96%) Influencing Skills
12 5 (0.80%) Health Technology
13 4 (0.64%) Agriculture
13 4 (0.64%) Aviation
13 4 (0.64%) Electronics
13 4 (0.64%) Manufacturing
13 4 (0.64%) Music Industry
14 3 (0.48%) Investment Banking
14 3 (0.48%) Retail Banking
Libraries, Frameworks & Software Standards
1 59 (9.47%) PySpark
2 38 (6.10%) Kafka
3 15 (2.41%) Pandas
4 14 (2.25%) Apache Beam
5 11 (1.77%) RESTful
6 8 (1.28%) GraphQL
7 7 (1.12%) JSON
8 6 (0.96%) Great Expectations
8 6 (0.96%) HTML
9 5 (0.80%) NumPy
9 5 (0.80%) REST
9 5 (0.80%) SciPy
10 4 (0.64%) .NET
10 4 (0.64%) AWS CDK
10 4 (0.64%) Flask
11 3 (0.48%) Elastic Stack
11 3 (0.48%) gRPC
11 3 (0.48%) Protocol Buffers
12 2 (0.32%) pytest
12 2 (0.32%) Spark Streaming
Miscellaneous
1 59 (9.47%) Data Structures
2 37 (5.94%) Self-Motivation
3 33 (5.30%) Product Ownership
4 27 (4.33%) Cloud Native
5 22 (3.53%) Algorithms
6 21 (3.37%) Client/Server
7 17 (2.73%) SCADA
8 16 (2.57%) Operational Technology
9 15 (2.41%) Greenfield Project
9 15 (2.41%) Management Information System
10 13 (2.09%) Online Games
11 12 (1.93%) IoT
12 9 (1.44%) Enterprise Software
13 7 (1.12%) NHS
13 7 (1.12%) Public Cloud
14 6 (0.96%) Enterprise Cloud
15 5 (0.80%) Blog
15 5 (0.80%) Data Centre
15 5 (0.80%) Mainframe
15 5 (0.80%) Onboarding
Operating Systems
1 28 (4.49%) Windows
2 21 (3.37%) Windows Server
3 18 (2.89%) Linux
4 13 (2.09%) Unix
5 4 (0.64%) CentOS
5 4 (0.64%) Solaris
5 4 (0.64%) Ubuntu
5 4 (0.64%) zOS
6 3 (0.48%) Android
6 3 (0.48%) Apple iOS
Processes & Methodologies
1 303 (48.64%) ETL
2 274 (43.98%) Data Engineering
3 207 (33.23%) Data Pipeline
4 202 (32.42%) Analytics
5 195 (31.30%) Data Modelling
6 148 (23.76%) Data Science
7 137 (21.99%) Business Intelligence
8 134 (21.51%) CI/CD
9 133 (21.35%) Agile
10 119 (19.10%) Data Integration
11 112 (17.98%) Machine Learning
12 103 (16.53%) DevOps
13 83 (13.32%) Problem-Solving
14 78 (12.52%) Artificial Intelligence
15 75 (12.04%) Data Governance
16 72 (11.56%) Data Transformation
17 71 (11.40%) Mentoring
18 65 (10.43%) Data Analytics
19 64 (10.27%) Visualisation
20 54 (8.67%) Data Architecture
Programming Languages
1 407 (65.33%) Python
2 393 (63.08%) SQL
3 47 (7.54%) Java
4 34 (5.46%) T-SQL
5 26 (4.17%) C#
6 25 (4.01%) Scala
7 22 (3.53%) Data Analysis Expressions
8 14 (2.25%) R
9 11 (1.77%) JavaScript
10 9 (1.44%) U-SQL
11 7 (1.12%) TypeScript
12 6 (0.96%) C
13 4 (0.64%) Kusto Query Language
13 4 (0.64%) PL/SQL
14 3 (0.48%) PHP
14 3 (0.48%) PowerShell
14 3 (0.48%) Ruby
15 2 (0.32%) Go
15 2 (0.32%) VBA
16 1 (0.16%) Google Apps Script
Qualifications
1 74 (11.88%) Degree
2 19 (3.05%) Computer Science Degree
3 14 (2.25%) Security Cleared
4 12 (1.93%) Microsoft Certification
5 10 (1.61%) Master's Degree
5 10 (1.61%) SC Cleared
6 6 (0.96%) DV Cleared
7 4 (0.64%) Azure Certification
7 4 (0.64%) CISM
7 4 (0.64%) CISSP
8 3 (0.48%) DBS Check
9 2 (0.32%) HNC
9 2 (0.32%) PhD
10 1 (0.16%) BPSS Clearance
10 1 (0.16%) ICAEW
10 1 (0.16%) Numerate Degree
10 1 (0.16%) PMI Certification
Quality Assurance & Compliance
1 120 (19.26%) Data Quality
2 10 (1.61%) QA
3 6 (0.96%) GDPR
4 4 (0.64%) ISO/IEC 27001
4 4 (0.64%) ISO/IEC 27002 (supersedes ISO/IEC 17799)
4 4 (0.64%) NIST
4 4 (0.64%) Solvency II
5 2 (0.32%) Accessibility
6 1 (0.16%) California Consumer Privacy Act
6 1 (0.16%) GMP
6 1 (0.16%) HIPAA
System Software
1 35 (5.62%) Docker
2 16 (2.57%) Hyper-V
2 16 (2.57%) VMware Infrastructure
3 3 (0.48%) Active Directory
4 1 (0.16%) Firmware
Systems Management
1 77 (12.36%) Terraform
2 59 (9.47%) Kubernetes
3 5 (0.80%) Ansible
3 5 (0.80%) logstash
4 2 (0.32%) Marathon
4 2 (0.32%) Mesos
Vendors
1 148 (23.76%) Databricks
2 78 (12.52%) Microsoft
3 53 (8.51%) Google
4 16 (2.57%) VMware
5 15 (2.41%) Oracle
6 10 (1.61%) Informatica
7 8 (1.28%) YouTube
8 7 (1.12%) MuleSoft
8 7 (1.12%) SAP
8 7 (1.12%) Teradata
9 5 (0.80%) Talend
10 4 (0.64%) Qualys
10 4 (0.64%) Splunk
11 3 (0.48%) Cloudera
11 3 (0.48%) SnapLogic
12 2 (0.32%) Ab Initio
12 2 (0.32%) ESRI
12 2 (0.32%) Hortonworks
12 2 (0.32%) NEC
12 2 (0.32%) Snowplow