Hybrid/Remote Retail Job Trends

Retailing
UK > Work from Home

The table below looks at the prevalence of the term Retail in remote or hybrid work. Included is a benchmarking guide to the salaries offered in vacancies that cited Retail over the 6 months leading up to 19 November 2025, comparing them to the same period in the previous two years.

6 months to
19 Nov 2025
Same period 2024 Same period 2023
Rank 55 71 45
Rank change year-on-year +16 -26 -2
Permanent jobs citing Retail 653 794 1,331
As % of all permanent jobs with remote/hybrid work options 4.27% 4.05% 6.20%
As % of the General category 6.51% 6.44% 9.48%
Number of salaries quoted 394 415 1,018
10th Percentile £27,707 £35,000 £36,250
25th Percentile £29,750 £45,000 £46,250
Median annual salary (50th Percentile) £50,000 £65,000 £60,249
Median % change year-on-year -23.08% +7.89% -1.66%
75th Percentile £76,549 £90,000 £80,627
90th Percentile £100,000 - £93,750
UK median annual salary £42,500 £52,500 £52,500
% change year-on-year -19.05% - -12.50%

All General Skills
Work from Home

Retail falls under the General Skills category. For comparison with the information above, the following table provides summary statistics for all permanent job vacancies with remote or hybrid options requiring common skills.

Permanent vacancies with a requirement for common skills 10,034 12,320 14,035
As % of all permanent jobs with a WFH option 65.68% 62.89% 65.42%
Number of salaries quoted 6,394 6,996 11,024
10th Percentile £28,500 £35,750 £36,250
25th Percentile £38,500 £46,250 £46,297
Median annual salary (50th Percentile) £55,000 £64,600 £62,500
Median % change year-on-year -14.86% +3.36% +0.81%
75th Percentile £77,500 £85,000 £82,500
90th Percentile £100,000 £110,000 £100,000
UK median annual salary £52,388 £60,000 £60,000
% change year-on-year -12.69% - -

Retail
Job Vacancy Trend for Remote/Hybrid Jobs

Historical trend showing the proportion of permanent IT job postings citing Retail and offering remote or hybrid work options relative to all permanent IT jobs advertised.
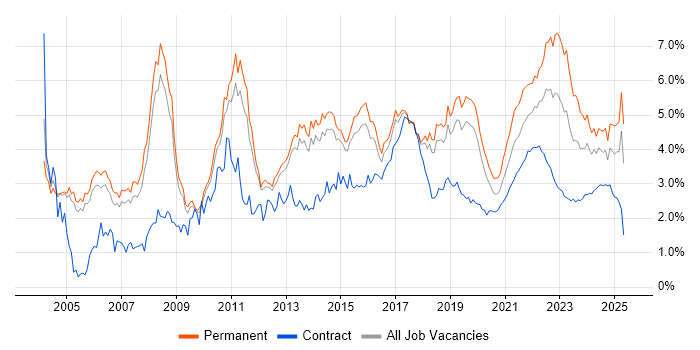
Retail job vacancy trend for remote/hybrid jobs

Retail
Salary Trend for Remote/Hybrid Jobs

Salary distribution trend for jobs with remote/hybrid work options citing Retail.

Salary distribution trend for jobs with remote/hybrid work options citing Retail

Retail
Salary Histogram for Remote/Hybrid Jobs

Salary distribution for jobs with remote/hybrid work options citing Retail over the 6 months to 19 November 2025.

Retail salary histogram for jobs with remote/hybrid work options

Retail
Co-Occurring Skills & Capabilities in Remote/Hybrid Jobs by Category

The following tables expand on the one above by listing co-occurrences grouped by category. They cover the same employment type, locality and period, with up to 20 co-occurrences shown in each category:

Application Platforms
1 16 (2.45%) SharePoint
2 15 (2.30%) Confluence
3 6 (0.92%) Microsoft Exchange
4 5 (0.77%) CMS
4 5 (0.77%) SAS
5 3 (0.46%) Apache Airflow
6 2 (0.31%) Apache Spark
6 2 (0.31%) IIS
7 1 (0.15%) Apache
7 1 (0.15%) Headless CMS
Applications
1 64 (9.80%) Chatbot
2 30 (4.59%) Microsoft Excel
3 23 (3.52%) Microsoft Office
4 15 (2.30%) MS Visio
5 13 (1.99%) Microsoft Project
6 10 (1.53%) Adobe Creative Suite
6 10 (1.53%) Microsoft PowerPoint
7 9 (1.38%) AutoCAD
8 6 (0.92%) Photoshop
8 6 (0.92%) Spreadsheet
9 3 (0.46%) 3ds Max
10 2 (0.31%) Adobe After Effects
10 2 (0.31%) Adobe Premiere
11 1 (0.15%) Camtasia
Business Applications
1 23 (3.52%) Shopify
2 15 (2.30%) Dynamics CRM
3 11 (1.68%) Oracle Assets
3 11 (1.68%) Oracle Cash Management
3 11 (1.68%) Oracle EBS
3 11 (1.68%) Oracle EBS R12
3 11 (1.68%) Oracle Payables
3 11 (1.68%) Oracle Receivables
4 10 (1.53%) SAP S/4HANA
5 6 (0.92%) Magento
5 6 (0.92%) Salesforce CRM
6 5 (0.77%) NetSuite
7 4 (0.61%) Sage 200
8 3 (0.46%) SAP CO
8 3 (0.46%) SAP FI
8 3 (0.46%) SAP FI/CO
8 3 (0.46%) SAP HCM
9 2 (0.31%) Dynamics NAV
9 2 (0.31%) ResourceLink
10 1 (0.15%) Dynamics GP
Cloud Services
1 142 (21.75%) SaaS
2 111 (17.00%) Azure
3 88 (13.48%) AWS
4 62 (9.49%) Power Platform
5 50 (7.66%) GCP
6 35 (5.36%) Azure DevOps
7 26 (3.98%) Microsoft 365
8 25 (3.83%) Dynamics 365
9 20 (3.06%) GitHub
10 17 (2.60%) Amazon EKS
10 17 (2.60%) Azure Cosmos DB
10 17 (2.60%) Power Automate
11 14 (2.14%) Google Analytics
12 10 (1.53%) Azure Service Bus
13 9 (1.38%) GitHub Actions
13 9 (1.38%) Snowflake
14 8 (1.23%) PowerApps
15 6 (0.92%) dbt
15 6 (0.92%) Serverless
15 6 (0.92%) SonarCloud
Communications & Networking
1 39 (5.97%) Remote Desktop
2 13 (1.99%) SD-WAN
3 11 (1.68%) TCP/IP
4 8 (1.23%) Internet
4 8 (1.23%) LAN
5 7 (1.07%) Firewall
5 7 (1.07%) WAN
6 6 (0.92%) 5G
6 6 (0.92%) HSRP
6 6 (0.92%) Intrusion Detection
6 6 (0.92%) VoIP
6 6 (0.92%) VRRP
7 5 (0.77%) VPN
8 4 (0.61%) DNS
8 4 (0.61%) Network Security
9 3 (0.46%) BGP
9 3 (0.46%) DHCP
9 3 (0.46%) VLAN
9 3 (0.46%) Wi-Fi
9 3 (0.46%) Wireless
Database & Business Intelligence
1 48 (7.35%) Power BI
2 29 (4.44%) SQL Server
3 24 (3.68%) Data Warehouse
4 20 (3.06%) Data Lake
5 17 (2.60%) Tableau
6 15 (2.30%) Azure SQL Database
7 12 (1.84%) Azure SQL Data Warehouse
7 12 (1.84%) BigQuery
8 10 (1.53%) Relational Database
9 9 (1.38%) Data Mining
10 8 (1.23%) Data Vault
11 6 (0.92%) Elasticsearch
11 6 (0.92%) Looker
11 6 (0.92%) NoSQL
12 5 (0.77%) SQL Server Integration Services
13 4 (0.61%) Amazon Redshift
13 4 (0.61%) DataStage
13 4 (0.61%) Metadata
13 4 (0.61%) PostgreSQL
13 4 (0.61%) QlikView
Development Applications
1 20 (3.06%) Git
1 20 (3.06%) TeamCity
2 19 (2.91%) JIRA
3 9 (1.38%) Visual Studio
4 8 (1.23%) Octopus Deploy
5 6 (0.92%) MSBuild
5 6 (0.92%) Team Foundation Server
5 6 (0.92%) Visual Studio Code
6 4 (0.61%) ER Studio
6 4 (0.61%) ERwin
6 4 (0.61%) PowerDesigner
7 3 (0.46%) Burp Suite
7 3 (0.46%) GitLab
7 3 (0.46%) JMeter
7 3 (0.46%) Metasploit
7 3 (0.46%) Postman
7 3 (0.46%) Selenium
8 1 (0.15%) Bazaar
8 1 (0.15%) Bitbucket
8 1 (0.15%) RStudio
General
1 242 (37.06%) Social Skills
2 202 (30.93%) Finance
3 136 (20.83%) Analytical Skills
4 112 (17.15%) Marketing
5 110 (16.85%) Inclusion and Diversity
6 56 (8.58%) Banking
7 44 (6.74%) Manufacturing
8 43 (6.58%) Back Office
8 43 (6.58%) Law
9 36 (5.51%) Financial Institution
10 33 (5.05%) Legal
11 31 (4.75%) Presentation Skills
12 23 (3.52%) Automotive
13 21 (3.22%) Public Sector
14 20 (3.06%) Organisational Skills
15 12 (1.84%) Advertising
16 11 (1.68%) Games
16 11 (1.68%) General Ledger
17 6 (0.92%) Pharmaceutical
17 6 (0.92%) Telecoms
Job Titles
1 110 (16.85%) Senior
2 80 (12.25%) Analyst
3 64 (9.80%) Trainer
4 50 (7.66%) Senior Manager
5 49 (7.50%) Architect
6 47 (7.20%) Account Manager
7 40 (6.13%) 2nd Line Support
8 39 (5.97%) Sales Account Manager
8 39 (5.97%) Sales Manager
8 39 (5.97%) Senior Account Manager
8 39 (5.97%) Senior Sales Manager
9 32 (4.90%) Lead
10 28 (4.29%) 1st/2nd Line Support
10 28 (4.29%) Developer
11 25 (3.83%) Consultant
12 24 (3.68%) Software Engineer
12 24 (3.68%) Solutions Architect
13 22 (3.37%) Support Analyst
14 21 (3.22%) Systems Manager
15 20 (3.06%) Data Analyst
Libraries, Frameworks & Software Standards
1 30 (4.59%) .NET
2 28 (4.29%) HTML
3 24 (3.68%) React
4 22 (3.37%) CSS
5 20 (3.06%) REST
6 17 (2.60%) Node.js
7 16 (2.45%) RESTful
8 14 (2.14%) JSON
8 14 (2.14%) React Native
8 14 (2.14%) Web Services
9 13 (1.99%) XML
10 12 (1.84%) .NET Core
11 8 (1.23%) Pandas
12 7 (1.07%) ASP.NET
12 7 (1.07%) Blazor
12 7 (1.07%) Bootstrap
13 6 (0.92%) gRPC
13 6 (0.92%) Vue
14 5 (0.77%) scikit-learn
14 5 (0.77%) Swagger
Miscellaneous
1 101 (15.47%) Onboarding
2 33 (5.05%) Cloud Native
3 30 (4.59%) Management Information System
4 19 (2.91%) Driving Licence
5 17 (2.60%) FMCG
6 15 (2.30%) Self-Motivation
7 14 (2.14%) Mobile App
8 13 (1.99%) Data Centre
8 13 (1.99%) EPoS
9 12 (1.84%) Distributed Systems
9 12 (1.84%) Product Ownership
9 12 (1.84%) Social Media
10 11 (1.68%) Analytical Mindset
11 10 (1.53%) Blog
12 9 (1.38%) Digital Signage
12 9 (1.38%) Enterprise Cloud
12 9 (1.38%) Security Posture
13 7 (1.07%) Hybrid Cloud
13 7 (1.07%) Insider Threat
13 7 (1.07%) IoT
Operating Systems
1 14 (2.14%) Windows
2 11 (1.68%) Linux
3 9 (1.38%) Mac OS
4 2 (0.31%) Windows Server
5 1 (0.15%) Unix
5 1 (0.15%) Windows 10
Processes & Methodologies
1 181 (27.72%) Customer Service
2 121 (18.53%) AI
3 114 (17.46%) Problem-Solving
4 109 (16.69%) ERP
5 101 (15.47%) CRM
6 97 (14.85%) Agile
7 92 (14.09%) E-Commerce
8 83 (12.71%) Mentoring
9 81 (12.40%) B2B
10 76 (11.64%) Continuous Improvement
11 75 (11.49%) Logistics
12 74 (11.33%) Analytics
13 70 (10.72%) Project Management
14 69 (10.57%) Roadmaps
15 68 (10.41%) Conversational UI
16 67 (10.26%) DevOps
17 64 (9.80%) Data Privacy
18 63 (9.65%) Stakeholder Management
19 62 (9.49%) Business Intelligence
20 59 (9.04%) CI/CD
Programming Languages
1 122 (18.68%) SQL
2 64 (9.80%) C#
3 51 (7.81%) Python
4 33 (5.05%) Java
5 23 (3.52%) JavaScript
6 12 (1.84%) R
7 8 (1.23%) Go
8 7 (1.07%) C++
8 7 (1.07%) Data Analysis Expressions
9 6 (0.92%) TypeScript
10 5 (0.77%) Bash
10 5 (0.77%) Kotlin
10 5 (0.77%) MATLAB
11 4 (0.61%) PHP
11 4 (0.61%) PowerShell
11 4 (0.61%) VBA
12 2 (0.31%) Apex Code
12 2 (0.31%) C
12 2 (0.31%) Delphi
12 2 (0.31%) Scala
Qualifications
1 136 (20.83%) Degree
2 20 (3.06%) Computer Science Degree
3 13 (1.99%) AWS Certification
3 13 (1.99%) Azure Certification
4 12 (1.84%) Security Cleared
5 11 (1.68%) CISSP
5 11 (1.68%) DBS Check
5 11 (1.68%) Master's Degree
5 11 (1.68%) SC Cleared
6 10 (1.53%) Microsoft Certification
7 7 (1.07%) Cisco Certification
7 7 (1.07%) CompTIA Security+
7 7 (1.07%) CREST Certified
7 7 (1.07%) OSCP
8 6 (0.92%) CISM
9 5 (0.77%) CEH
9 5 (0.77%) SAP Certification
10 4 (0.61%) CCNA
10 4 (0.61%) MCSE
10 4 (0.61%) PRINCE2 Practitioner
Quality Assurance & Compliance
1 60 (9.19%) QA
2 25 (3.83%) GDPR
3 20 (3.06%) ISO/IEC 27001
4 14 (2.14%) PMO
4 14 (2.14%) SLA
5 13 (1.99%) Accessibility
6 10 (1.53%) Data Quality
6 10 (1.53%) PCI DSS
6 10 (1.53%) SOC 2
7 7 (1.07%) Actionable Recommendations
8 6 (0.92%) NIST
9 4 (0.61%) EU AI Act
9 4 (0.61%) GRC
9 4 (0.61%) WCAG
10 2 (0.31%) California Consumer Privacy Act
10 2 (0.31%) PERC
11 1 (0.15%) ISO 19650
11 1 (0.15%) ISO/IEC 20000
System Software
1 15 (2.30%) Active Directory
1 15 (2.30%) Docker
2 7 (1.07%) VMware Infrastructure
3 2 (0.31%) Hyper-V
4 1 (0.15%) Embedded Firmware
4 1 (0.15%) Firmware
4 1 (0.15%) HDFS
4 1 (0.15%) Virtual Machines
4 1 (0.15%) vSphere
Systems Management
1 32 (4.90%) Terraform
2 29 (4.44%) Kubernetes
3 14 (2.14%) Grafana
4 4 (0.61%) Cilium
4 4 (0.61%) Microsoft Intune
5 3 (0.46%) Nmap
6 2 (0.31%) Autotask
7 1 (0.15%) Ansible
7 1 (0.15%) Single Sign-On
7 1 (0.15%) Systems Management Server (SMS)
7 1 (0.15%) vRealize Orchestrator
Vendors
1 111 (17.00%) Microsoft
2 64 (9.80%) PayPal
3 40 (6.13%) Salesforce
4 32 (4.90%) Google
5 31 (4.75%) Adobe
6 24 (3.68%) SAP
7 22 (3.37%) Databricks
8 19 (2.91%) HubSpot
9 17 (2.60%) Oracle
10 12 (1.84%) Cisco
11 10 (1.53%) TikTok
12 8 (1.23%) Alteryx
12 8 (1.23%) VMware
13 6 (0.92%) Avaya
13 6 (0.92%) Extreme Networks
14 5 (0.77%) Ariba
15 4 (0.61%) IBM
15 4 (0.61%) Informatica
15 4 (0.61%) OpenAI
15 4 (0.61%) Sage