Algorithms Jobs with Work from Home Options

Algorithms
UK > Work from Home

The table below looks at the prevalence of the term Algorithms in permanent job vacancies with an option to work from home (WFH). Included is a benchmarking guide to the salaries offered in vacancies that have cited Algorithms over the 6 months to 26 April 2024 with a comparison to the same period over the previous 2 years.

6 months to
26 Apr 2024
Same period 2023 Same period 2022
Rank 234 248 165
Rank change year-on-year +14 -83 +57
Permanent jobs citing Algorithms 456 598 1,569
As % of all permanent jobs with a WFH option 1.35% 1.38% 2.35%
As % of the Miscellaneous category 3.80% 3.58% 5.11%
Number of salaries quoted 272 443 516
10th Percentile £39,000 £42,500 £45,000
25th Percentile £52,500 £56,052 £60,000
Median annual salary (50th Percentile) £65,000 £75,000 £77,500
Median % change year-on-year -13.33% -3.23% +24.00%
75th Percentile £82,500 £96,250 £88,750
90th Percentile £95,000 £121,250 £107,500
UK median annual salary £65,000 £75,000 £70,000
% change year-on-year -13.33% +7.14% +7.69%

All Generic Skills
Work from Home

Algorithms is in the General and Transferable Skills category. The following table is for comparison with the above and provides summary statistics for all permanent job vacancies with a WFH option and a requirement for generic IT skills.

Permanent vacancies with a requirement for generic IT skills 11,987 16,704 30,727
As % of all permanent jobs with a WFH option 35.44% 38.63% 46.04%
Number of salaries quoted 9,217 11,985 16,722
10th Percentile £32,500 £39,000 £37,500
25th Percentile £42,500 £48,750 £47,500
Median annual salary (50th Percentile) £59,000 £65,000 £65,000
Median % change year-on-year -9.23% - +13.04%
75th Percentile £77,750 £86,250 £83,750
90th Percentile £100,000 £106,250 £100,000
UK median annual salary £55,000 £65,000 £62,500
% change year-on-year -15.38% +4.00% +4.17%

Algorithms
Trend for Jobs with a WFH Option

Job vacancies with a work from home option citing Algorithms as a proportion of all IT jobs advertised.
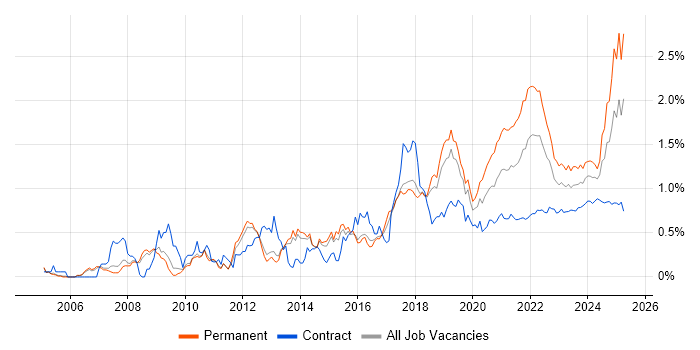
Algorithms trend for jobs with a WFH option

Algorithms
Salary Trend for Jobs with a WFH Option

3-month moving average salary quoted in job vacancies with a work from home option citing Algorithms.

Algorithms salary trend for jobs with a WFH option

Algorithms
Salary Histogram for Jobs with a WFH Option

Salary distribution for jobs with a work from home option citing Algorithms over the 6 months to 26 April 2024.

Algorithms salary histogram for jobs with a WFH option

Algorithms
Co-occurring Skills and Capabilities with WFH Options by Category

The follow tables expand on the table above by listing co-occurrences grouped by category. The same employment type, locality and period is covered with up to 20 co-occurrences shown in each of the following categories:

Application Platforms
1 36 (7.89%) Apache Spark
2 6 (1.32%) Apache
3 4 (0.88%) Apache Airflow
4 3 (0.66%) SharePoint
5 1 (0.22%) ArcGIS
5 1 (0.22%) Ethereum
5 1 (0.22%) Hyperledger
5 1 (0.22%) Luigi
5 1 (0.22%) WordPress
Applications
1 34 (7.46%) Simulink
2 11 (2.41%) Stateflow
3 9 (1.97%) Spreadsheet
4 5 (1.10%) Microsoft Excel
5 2 (0.44%) Microsoft PowerPoint
6 1 (0.22%) Adobe Creative Suite
6 1 (0.22%) Adobe Illustrator
6 1 (0.22%) Blender
6 1 (0.22%) InVision
6 1 (0.22%) Microsoft Office
6 1 (0.22%) Photoshop
6 1 (0.22%) Sketch
6 1 (0.22%) Zeplin
Business Applications
1 3 (0.66%) ProductWriter
1 3 (0.66%) SAP Business One
2 1 (0.22%) Data Workbench
2 1 (0.22%) Distributed Ledger
2 1 (0.22%) Endur
2 1 (0.22%) SAP S/4HANA
2 1 (0.22%) Yoast SEO
Cloud Services
1 86 (18.86%) AWS
2 50 (10.96%) GCP
3 49 (10.75%) Azure
4 39 (8.55%) SaaS
5 23 (5.04%) Amazon S3
5 23 (5.04%) Amazon SQS
5 23 (5.04%) Google Docs
5 23 (5.04%) Lucidchart
5 23 (5.04%) Miro
5 23 (5.04%) Slack
6 15 (3.29%) Serverless
7 14 (3.07%) AWS Lambda
8 13 (2.85%) GitHub
8 13 (2.85%) Power Platform
9 9 (1.97%) Snowflake
10 7 (1.54%) Azure Machine Learning
11 5 (1.10%) Azure DevOps
11 5 (1.10%) Azure Synapse Analytics
12 4 (0.88%) Amazon Kinesis
12 4 (0.88%) PowerApps
Communications & Networking
1 9 (1.97%) Internet
2 8 (1.75%) TCP/IP
2 8 (1.75%) Wireless
3 6 (1.32%) Firewall
4 5 (1.10%) BGP
4 5 (1.10%) Intrusion Detection
4 5 (1.10%) IPsec
4 5 (1.10%) LAN
4 5 (1.10%) Network Security
4 5 (1.10%) NGFW
4 5 (1.10%) OSPF
4 5 (1.10%) SSL
4 5 (1.10%) VLAN
4 5 (1.10%) VPN
4 5 (1.10%) WAN
5 4 (0.88%) Broadband
5 4 (0.88%) Ethernet
5 4 (0.88%) WPA
6 3 (0.66%) DHCP
6 3 (0.66%) DNS
Database & Business Intelligence
1 44 (9.65%) Big Data
2 42 (9.21%) Redis
3 38 (8.33%) Tableau
4 33 (7.24%) Hadoop
5 31 (6.80%) Elasticsearch
6 23 (5.04%) Scylla
7 21 (4.61%) Relational Database
8 18 (3.95%) Data Warehouse
9 14 (3.07%) Data Lake
10 13 (2.85%) PostgreSQL
10 13 (2.85%) Power BI
11 11 (2.41%) Data Mining
12 9 (1.97%) NoSQL
13 8 (1.75%) SQL Server
14 7 (1.54%) Flink
14 7 (1.54%) MySQL
15 6 (1.32%) BigQuery
16 5 (1.10%) RDBMS
17 4 (0.88%) Amazon Aurora
17 4 (0.88%) Apache Hive
Development Applications
1 53 (11.62%) Git
2 18 (3.95%) CMake
3 16 (3.51%) Subversion
4 13 (2.85%) JIRA
5 7 (1.54%) ClearCase
5 7 (1.54%) ClearQuest
5 7 (1.54%) Plastic SCM
6 5 (1.10%) Jenkins
6 5 (1.10%) LabVIEW
6 5 (1.10%) Visual Studio
7 4 (0.88%) Oracle Forms
8 3 (0.66%) Eclipse
8 3 (0.66%) JUnit
9 2 (0.44%) GitLab
10 1 (0.22%) Gatling
10 1 (0.22%) GCC
10 1 (0.22%) LoadRunner
10 1 (0.22%) MLflow
10 1 (0.22%) Sonatype Nexus
General
1 181 (39.69%) Social Skills
2 63 (13.82%) Legal
3 53 (11.62%) Finance
4 41 (8.99%) Inclusion and Diversity
5 39 (8.55%) Analytical Skills
6 32 (7.02%) Retail
7 26 (5.70%) Military
8 24 (5.26%) Marketing
9 18 (3.95%) Aerospace
10 14 (3.07%) Automotive
11 13 (2.85%) Manufacturing
12 11 (2.41%) Games
12 11 (2.41%) Pharmaceutical
13 9 (1.97%) Italian Language
13 9 (1.97%) Multimedia
13 9 (1.97%) Tech for Good
14 8 (1.75%) Banking
14 8 (1.75%) Electronics
15 7 (1.54%) Health Technology
15 7 (1.54%) Organisational Skills
Job Titles
1 107 (23.46%) Senior
1 107 (23.46%) Software Engineer
2 84 (18.42%) Developer
3 66 (14.47%) Lead
4 60 (13.16%) Data Scientist
5 45 (9.87%) Senior Data Scientist
6 35 (7.68%) Principal Engineer
7 34 (7.46%) Team Leader
8 28 (6.14%) Senior Developer
9 25 (5.48%) Principal Software Engineer
9 25 (5.48%) Software Developer
10 22 (4.82%) Data Engineer
11 20 (4.39%) Senior Software Engineer
12 19 (4.17%) C# Software Engineer
12 19 (4.17%) Product Manager
13 18 (3.95%) C++ Software Engineer
13 18 (3.95%) Systems Engineer
14 16 (3.51%) .NET Software Engineer
14 16 (3.51%) Senior C++ Software Engineer
15 14 (3.07%) Senior Software Developer
Libraries, Frameworks & Software Standards
1 49 (10.75%) Kafka
2 44 (9.65%) TensorFlow
3 37 (8.11%) .NET
4 33 (7.24%) Pandas
5 32 (7.02%) .NET Core
6 31 (6.80%) PySpark
6 31 (6.80%) scikit-learn
7 27 (5.92%) Node.js
8 24 (5.26%) GraphQL
8 24 (5.26%) React
9 23 (5.04%) AngularJS
9 23 (5.04%) PyTorch
10 18 (3.95%) STL
11 17 (3.73%) XML
12 16 (3.51%) MFC
12 16 (3.51%) Qt
13 15 (3.29%) Web Services
14 13 (2.85%) CSS
15 9 (1.97%) WebGL
16 8 (1.75%) REST
Miscellaneous
1 168 (36.84%) Data Structures
2 42 (9.21%) Client/Server
3 23 (5.04%) Product Ownership
4 20 (4.39%) Management Information System
5 16 (3.51%) Embedded Systems
6 14 (3.07%) Cloud Native
7 13 (2.85%) CUDA
8 12 (2.63%) PMI
9 11 (2.41%) Life Science
10 10 (2.19%) Virtual Reality
10 10 (2.19%) Virtual Team
11 9 (1.97%) Augmented Reality
11 9 (1.97%) Distributed Systems
12 8 (1.75%) Data Centre
12 8 (1.75%) IoT
12 8 (1.75%) Mobile App
13 7 (1.54%) Robotics
14 6 (1.32%) Chip and PIN
15 5 (1.10%) Hybrid Cloud
15 5 (1.10%) Social Media
Operating Systems
1 39 (8.55%) Linux
2 21 (4.61%) Windows
3 12 (2.63%) Android
4 10 (2.19%) Apple iOS
5 9 (1.97%) Unix
6 1 (0.22%) Mac OS
6 1 (0.22%) Windows 10
6 1 (0.22%) Windows Server
6 1 (0.22%) Windows Server 2019
Processes & Methodologies
1 186 (40.79%) Software Engineering
2 149 (32.68%) Computer Science
3 144 (31.58%) Problem-Solving
4 136 (29.82%) Data Science
5 134 (29.39%) Agile
6 121 (26.54%) Mathematics
7 116 (25.44%) Machine Learning
8 110 (24.12%) Visualisation
9 97 (21.27%) Artificial Intelligence
10 91 (19.96%) Decision-Making
11 87 (19.08%) Analytics
12 78 (17.11%) Data Analysis
13 69 (15.13%) Data Visualisation
14 64 (14.04%) Data Modelling
14 64 (14.04%) Data Strategy
15 61 (13.38%) User Experience
16 60 (13.16%) Data Management
16 60 (13.16%) ETL
17 55 (12.06%) Roadmaps
18 54 (11.84%) Mentoring
Programming Languages
1 214 (46.93%) Python
2 116 (25.44%) SQL
3 78 (17.11%) Java
4 49 (10.75%) C
5 47 (10.31%) C#
6 43 (9.43%) TypeScript
7 42 (9.21%) Go
8 39 (8.55%) C++
9 38 (8.33%) Scala
10 35 (7.68%) MATLAB
11 32 (7.02%) JavaScript
12 28 (6.14%) Bash
13 22 (4.82%) R
14 12 (2.63%) Embedded C
15 9 (1.97%) Fortran
16 6 (1.32%) PowerShell
17 3 (0.66%) Data Analysis Expressions
17 3 (0.66%) Ruby
18 2 (0.44%) Assembly Language
18 2 (0.44%) T-SQL
Qualifications
1 225 (49.34%) Degree
2 85 (18.64%) Security Cleared
3 81 (17.76%) Master's Degree
4 47 (10.31%) Computer Science Degree
5 46 (10.09%) BPSS Clearance
6 35 (7.68%) DBS Check
6 35 (7.68%) PhD
7 26 (5.70%) SC Cleared
8 12 (2.63%) MBA
8 12 (2.63%) PMI Certification
9 11 (2.41%) Numerate Degree
10 5 (1.10%) CCIE
10 5 (1.10%) Cisco Certification
10 5 (1.10%) JNCIE
11 4 (0.88%) DV Cleared
12 3 (0.66%) ITIL Certification
12 3 (0.66%) Postgraduate
13 1 (0.22%) MCP
13 1 (0.22%) Microsoft Certification
Quality Assurance & Compliance
1 15 (3.29%) QA
2 10 (2.19%) Accessibility
3 8 (1.75%) Data Quality
4 7 (1.54%) MISRA
5 2 (0.44%) GDPR
6 1 (0.22%) AUTOSAR
System Software
1 18 (3.95%) Docker
2 16 (3.51%) Firmware
3 4 (0.88%) Virtual Desktop
4 3 (0.66%) Active Directory
5 1 (0.22%) HDFS
5 1 (0.22%) Hyper-V
5 1 (0.22%) Microsoft Virtual Server
5 1 (0.22%) Virtual Servers
5 1 (0.22%) VMware ESXi
Systems Management
1 56 (12.28%) Kubernetes
2 8 (1.75%) Ansible
3 5 (1.10%) Terraform
4 1 (0.22%) Istio
4 1 (0.22%) Kubeflow
4 1 (0.22%) SCCM
Vendors
1 42 (9.21%) Databricks
2 35 (7.68%) Google
3 27 (5.92%) Microsoft
4 23 (5.04%) Dell
5 13 (2.85%) NVIDIA
6 9 (1.97%) SAP
7 8 (1.75%) Oracle
8 7 (1.54%) IBM
8 7 (1.54%) Lauterbach
9 6 (1.32%) Teradata
9 6 (1.32%) Thales
10 5 (1.10%) Facebook
10 5 (1.10%) ServiceNow
11 4 (0.88%) Ahrefs
11 4 (0.88%) OpenAI
11 4 (0.88%) Screaming Frog
12 3 (0.66%) Instagram
12 3 (0.66%) Salesforce
12 3 (0.66%) Xilinx
13 2 (0.44%) Adobe