Data Quality Jobs with Work from Home Options

Data Quality
UK > Work from Home

The table below provides summary statistics for permanent remote or hybrid work requiring Data Quality skills. It includes a benchmarking guide to the annual salaries offered in vacancies that cited Data Quality over the 6 months leading up to 26 July 2024, comparing them to the same period in the previous two years.

6 months to
26 Jul 2024
Same period 2023 Same period 2022
Rank 160 225 274
Rank change year-on-year +65 +49 +63
Permanent jobs citing Data Quality 581 486 1,120
As % of all permanent jobs with a WFH option 2.08% 1.48% 1.43%
As % of the Quality Assurance & Compliance category 15.94% 10.37% 8.87%
Number of salaries quoted 471 354 491
10th Percentile £37,250 £40,787 £33,750
25th Percentile £52,500 £47,615 £45,000
Median annual salary (50th Percentile) £80,000 £60,249 £60,000
Median % change year-on-year +32.78% +0.42% +4.35%
75th Percentile £122,500 £80,000 £78,750
90th Percentile £148,750 £92,500 £95,000
UK median annual salary £72,246 £65,000 £60,000
% change year-on-year +11.15% +8.33% +4.35%

All Quality Assurance and Compliance Skills
Work from Home

Data Quality falls under the Quality Assurance and Compliance category. For comparison with the information above, the following table provides summary statistics for all permanent job vacancies with remote or hybrid options requiring quality assurance or compliance skills.

Permanent vacancies with a requirement for quality assurance or compliance skills 3,644 4,686 12,625
As % of all permanent jobs with a WFH option 13.04% 14.28% 16.08%
Number of salaries quoted 2,573 3,463 6,469
10th Percentile £35,050 £37,500 £32,500
25th Percentile £45,000 £45,750 £42,500
Median annual salary (50th Percentile) £58,457 £60,000 £57,500
Median % change year-on-year -2.57% +4.35% +9.52%
75th Percentile £77,500 £77,500 £73,000
90th Percentile £97,500 £92,500 £90,000
UK median annual salary £53,500 £57,500 £55,000
% change year-on-year -6.96% +4.55% +2.33%

Data Quality
Trend for Jobs with a WFH Option

Job vacancies with a work from home option citing Data Quality as a proportion of all IT jobs advertised.
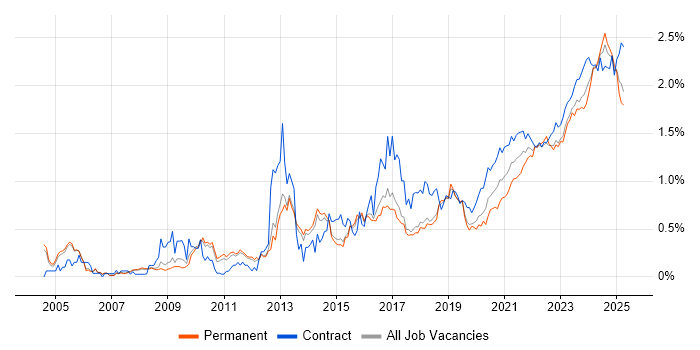
Data Quality trend for jobs with a WFH option

Data Quality
Salary Trend for Jobs with a WFH Option

3-month moving average salary quoted in job vacancies with a work from home option citing Data Quality.

Data Quality salary trend for jobs with a WFH option

Data Quality
Salary Histogram for Jobs with a WFH Option

Salary distribution for jobs with a work from home option citing Data Quality over the 6 months to 26 July 2024.

Data Quality salary histogram for jobs with a WFH option

Data Quality
Co-occurring Skills and Capabilities with WFH Options by Category

The follow tables expand on the table above by listing co-occurrences grouped by category. The same employment type, locality and period is covered with up to 20 co-occurrences shown in each of the following categories:

Application Platforms
1 191 (32.87%) Apache Airflow
2 189 (32.53%) Apache
3 29 (4.99%) Apache Spark
4 10 (1.72%) SharePoint
5 6 (1.03%) Confluence
5 6 (1.03%) SAS
6 3 (0.52%) Luigi
7 1 (0.17%) Cloud Foundry
Applications
1 43 (7.40%) Microsoft Excel
2 14 (2.41%) Microsoft Office
3 2 (0.34%) Microsoft PowerPoint
Business Applications
1 11 (1.89%) SAP S/4HANA
2 3 (0.52%) iTrent
3 2 (0.34%) MIS ActiveH
3 2 (0.34%) NEC Housing
3 2 (0.34%) Remedy ITSM
3 2 (0.34%) Salesforce CRM
4 1 (0.17%) Lorenzo
Cloud Services
1 235 (40.45%) AWS
2 194 (33.39%) Snowflake
3 190 (32.70%) dbt
4 121 (20.83%) Azure
5 79 (13.60%) Power Platform
6 37 (6.37%) Azure Data Factory
7 30 (5.16%) GCP
8 29 (4.99%) Azure Synapse Analytics
9 22 (3.79%) Microsoft Purview
10 19 (3.27%) Azure DevOps
11 16 (2.75%) PowerApps
12 15 (2.58%) Collibra
13 14 (2.41%) Amazon S3
13 14 (2.41%) GitHub
14 12 (2.07%) Dynamics 365
15 11 (1.89%) IaaS
15 11 (1.89%) Nutanix
16 10 (1.72%) Power Automate
17 9 (1.55%) Microsoft 365
18 7 (1.20%) Amazon EMR
Communications & Networking
1 11 (1.89%) DNS
2 2 (0.34%) WebEx
3 1 (0.17%) Intranet
3 1 (0.17%) Skype
Database & Business Intelligence
1 221 (38.04%) Data Lake
2 179 (30.81%) Amazon Athena
3 175 (30.12%) Apache Arrow
3 175 (30.12%) Apache Ignite
3 175 (30.12%) Dremio
4 119 (20.48%) Data Warehouse
5 77 (13.25%) Power BI
6 68 (11.70%) Metadata
7 43 (7.40%) SQL Server
8 32 (5.51%) Tableau
9 30 (5.16%) Big Data
10 24 (4.13%) SQL Server Integration Services
11 21 (3.61%) NoSQL
12 19 (3.27%) Relational Database
13 16 (2.75%) Azure SQL Database
14 14 (2.41%) BusinessObjects
15 13 (2.24%) Data Mining
16 11 (1.89%) BigQuery
16 11 (1.89%) Spark SQL
16 11 (1.89%) SQL Server Reporting Services
Development Applications
1 16 (2.75%) Git
2 9 (1.55%) JIRA
3 8 (1.38%) RStudio
4 6 (1.03%) Jenkins
5 5 (0.86%) GitLab
5 5 (0.86%) SQL Server Management Studio (SSMS)
5 5 (0.86%) Visual Studio
6 2 (0.34%) CircleCI
6 2 (0.34%) Deequ
7 1 (0.17%) Mockito
7 1 (0.17%) Spinnaker
General
1 294 (50.60%) Finance
2 207 (35.63%) Banking
3 175 (30.12%) Front Office
3 175 (30.12%) Investment Banking
4 117 (20.14%) Analytical Skills
5 105 (18.07%) Social Skills
6 35 (6.02%) Inclusion and Diversity
7 29 (4.99%) Marketing
8 28 (4.82%) Retail
9 25 (4.30%) Influencing Skills
10 18 (3.10%) Legal
10 18 (3.10%) Public Sector
11 14 (2.41%) Law
11 14 (2.41%) Telecoms
12 11 (1.89%) Organisational Skills
13 8 (1.38%) Back Office
13 8 (1.38%) Billing
13 8 (1.38%) Local Government
14 4 (0.69%) General Ledger
14 4 (0.69%) Presentation Skills
Job Titles
1 137 (23.58%) Senior
2 127 (21.86%) Lead
3 98 (16.87%) Data Engineer
4 97 (16.70%) Analyst
5 94 (16.18%) AWS Engineer
6 92 (15.83%) Technical Leader
7 87 (14.97%) AWS Software Engineer
7 87 (14.97%) Software Engineer
8 74 (12.74%) Data Analyst
9 71 (12.22%) Senior Software Engineer
10 47 (8.09%) Java Engineer
11 45 (7.75%) Python Engineer
12 44 (7.57%) Java Software Engineer
13 43 (7.40%) Python Software Engineer
14 33 (5.68%) Governance Analyst
15 30 (5.16%) Developer
16 28 (4.82%) Architect
16 28 (4.82%) Senior Java Engineer
16 28 (4.82%) Senior Java Software Engineer
17 23 (3.96%) Data Architect
Libraries, Frameworks & Software Standards
1 181 (31.15%) Pandas
2 176 (30.29%) NumPy
3 175 (30.12%) gRPC
3 175 (30.12%) Protocol Buffers
3 175 (30.12%) SciPy
4 31 (5.34%) PySpark
5 10 (1.72%) Kafka
6 5 (0.86%) Middleware
7 4 (0.69%) Great Expectations
7 4 (0.69%) JSON
8 3 (0.52%) HTML5 Canvas
8 3 (0.52%) SQLAlchemy
8 3 (0.52%) XML
9 2 (0.34%) Apache Beam
9 2 (0.34%) Lambda Expressions
9 2 (0.34%) Node.js
9 2 (0.34%) PyTorch
9 2 (0.34%) TensorFlow
10 1 (0.17%) FHIR
10 1 (0.17%) OpenAPI
Miscellaneous
1 175 (30.12%) Derivative
1 175 (30.12%) Equities
1 175 (30.12%) Fixed Income
1 175 (30.12%) Foreign Exchange (FX)
1 175 (30.12%) Hedge funds
2 23 (3.96%) Data Structures
3 22 (3.79%) Analytical Mindset
4 20 (3.44%) Management Information System
5 19 (3.27%) Onboarding
6 16 (2.75%) Reference Data
7 12 (2.07%) IoT
8 9 (1.55%) Algorithms
8 9 (1.55%) Cloud Native
8 9 (1.55%) Reinsurance
9 8 (1.38%) Blog
9 8 (1.38%) Enterprise Software
9 8 (1.38%) Renewable Energy
10 7 (1.20%) e-Learning
10 7 (1.20%) Taxonomies
11 6 (1.03%) Video Conferencing
Operating Systems
1 14 (2.41%) Windows
2 7 (1.20%) Linux
3 2 (0.34%) Windows Vista
4 1 (0.17%) Windows Server
Processes & Methodologies
1 255 (43.89%) Agile
2 187 (32.19%) Asset Management
3 178 (30.64%) Investment Management
3 178 (30.64%) Software Engineering
4 175 (30.12%) Greeks
5 172 (29.60%) Data Governance
6 142 (24.44%) Analytics
7 129 (22.20%) Data Management
8 123 (21.17%) Data Modelling
9 113 (19.45%) Business Intelligence
10 101 (17.38%) ETL
11 94 (16.18%) Problem-Solving
12 85 (14.63%) Data Pipeline
13 78 (13.43%) Data Engineering
14 71 (12.22%) Data Analysis
15 61 (10.50%) Data Architecture
16 58 (9.98%) Decision-Making
17 55 (9.47%) Data Science
17 55 (9.47%) Visualisation
18 50 (8.61%) DataOps
Programming Languages
1 289 (49.74%) Python
2 205 (35.28%) SQL
3 198 (34.08%) Java
4 175 (30.12%) JavaScript
4 175 (30.12%) TypeScript
5 24 (4.13%) R
6 23 (3.96%) T-SQL
7 19 (3.27%) Bash
8 11 (1.89%) Perl
9 9 (1.55%) Scala
9 9 (1.55%) VBA
10 8 (1.38%) Kotlin
10 8 (1.38%) PowerShell
11 4 (0.69%) PL/SQL
12 2 (0.34%) Data Analysis Expressions
Qualifications
1 65 (11.19%) Degree
2 29 (4.99%) Security Cleared
3 24 (4.13%) SC Cleared
4 19 (3.27%) Computer Science Degree
5 13 (2.24%) DBS Check
6 8 (1.38%) Azure Certification
6 8 (1.38%) Master's Degree
7 7 (1.20%) PMI Certification
8 3 (0.52%) Microsoft Certification
8 3 (0.52%) PMP
9 2 (0.34%) Numerate Degree
10 1 (0.17%) ACCA
10 1 (0.17%) CIMA
10 1 (0.17%) DV Cleared
10 1 (0.17%) PhD
10 1 (0.17%) TOGAF Certification
Quality Assurance & Compliance
1 13 (2.24%) QA
2 11 (1.89%) GDPR
3 7 (1.20%) COBIT
4 5 (0.86%) Accessibility
5 3 (0.52%) California Consumer Privacy Act
5 3 (0.52%) PMO
6 2 (0.34%) HIPAA
7 1 (0.17%) COREP
7 1 (0.17%) Disclosure Scotland
7 1 (0.17%) FINREP
7 1 (0.17%) SNOMED CT
System Software
1 12 (2.07%) VMware Infrastructure
2 11 (1.89%) Active Directory
2 11 (1.89%) Virtual Machines
3 3 (0.52%) Docker
Systems Management
1 15 (2.58%) Terraform
2 5 (0.86%) Kubernetes
2 5 (0.86%) logstash
3 1 (0.17%) Ansible
Vendors
1 70 (12.05%) Microsoft
2 64 (11.02%) Databricks
3 27 (4.65%) Informatica
4 26 (4.48%) Salesforce
5 20 (3.44%) Google
6 19 (3.27%) SAP
7 13 (2.24%) Oracle
8 12 (2.07%) VMware
9 11 (1.89%) Talend
10 8 (1.38%) Alteryx
11 6 (1.03%) Facebook
11 6 (1.03%) Jitterbit
12 4 (0.69%) ServiceNow
12 4 (0.69%) TIBCO
13 3 (0.52%) BMC
14 2 (0.34%) Ab Initio
14 2 (0.34%) Cloudera
14 2 (0.34%) NEC
14 2 (0.34%) OpenAI
14 2 (0.34%) Remedy