Marketing Jobs with Hybrid/Remote/WFH Options

Marketing
UK > Work from Home

The table below looks at the prevalence of the term Marketing in remote or hybrid work. Included is a benchmarking guide to the salaries offered in vacancies that cited Marketing over the 6 months leading up to 25 April 2025, comparing them to the same period in the previous two years.

6 months to
25 Apr 2025
Same period 2024 Same period 2023
Rank 41 45 44
Rank change year-on-year +4 -1 +7
Permanent jobs citing Marketing 857 1,873 2,767
As % of all permanent jobs with a WFH option 5.66% 5.54% 6.34%
As % of the General category 7.54% 9.03% 9.54%
Number of salaries quoted 425 1,284 1,095
10th Percentile £31,100 £28,750 £36,250
25th Percentile £40,600 £35,000 £45,000
Median annual salary (50th Percentile) £57,500 £45,001 £60,000
Median % change year-on-year +27.78% -25.00% +9.09%
75th Percentile £77,500 £61,250 £80,000
90th Percentile £105,750 £76,250 £97,500
UK median annual salary £55,000 £45,000 £55,000
% change year-on-year +22.22% -18.18% -

All General Skills
Work from Home

Marketing falls under the General Skills category. For comparison with the information above, the following table provides summary statistics for all permanent job vacancies with remote or hybrid options requiring common skills.

Permanent vacancies with a requirement for common skills 11,371 20,739 29,007
As % of all permanent jobs with a WFH option 75.13% 61.37% 66.47%
Number of salaries quoted 7,482 15,161 19,119
10th Percentile £25,313 £31,750 £36,250
25th Percentile £42,500 £41,750 £46,570
Median annual salary (50th Percentile) £57,500 £55,500 £62,500
Median % change year-on-year +3.60% -11.20% +4.17%
75th Percentile £77,500 £75,000 £82,500
90th Percentile £106,250 £95,000 £101,250
UK median annual salary £57,000 £52,500 £60,000
% change year-on-year +8.57% -12.50% -

Marketing
Trend for Jobs with a WFH Option

Job vacancies with remote working options citing Marketing as a proportion of all IT jobs advertised.
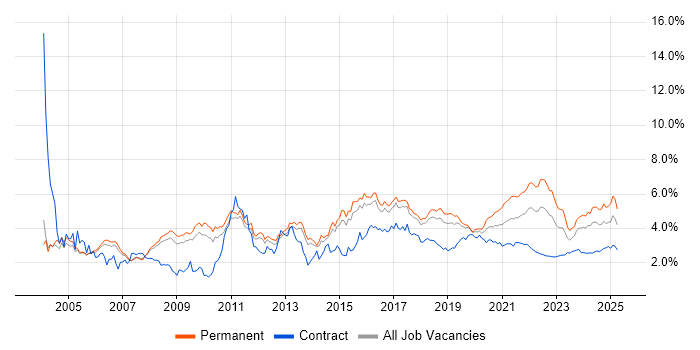
Marketing trend for jobs with Hybrid/Remote/WFH options

Marketing
Salary Trend for Jobs with a WFH Option

3-month moving average salary quoted in job vacancies with remote working options citing Marketing.

Marketing salary trend for jobs with a WFH option

Marketing
Salary Histogram for Jobs with a WFH Option

Salary distribution for jobs with remote working options citing Marketing over the 6 months to 25 April 2025.

Marketing salary histogram for jobs with a WFH option

Marketing
Co-occurring Skills and Capabilities with WFH Options by Category

The follow tables expand on the table above by listing co-occurrences grouped by category. The same employment type, locality and period is covered with up to 20 co-occurrences shown in each of the following categories:

Application Platforms
1 80 (9.33%) CMS
2 26 (3.03%) WordPress
3 13 (1.52%) SharePoint
4 11 (1.28%) Kentico
5 10 (1.17%) Sitecore CMS
6 9 (1.05%) Drupal
6 9 (1.05%) Umbraco
7 7 (0.82%) Confluence
8 5 (0.58%) Headless CMS
9 4 (0.47%) Apache Spark
9 4 (0.47%) Oracle SOA Suite
10 3 (0.35%) Apache Solr
10 3 (0.35%) Ethereum
10 3 (0.35%) IBM Domino
11 2 (0.23%) Apache Airflow
11 2 (0.23%) Microsoft Exchange
12 1 (0.12%) Jupyter
12 1 (0.12%) Moodle
12 1 (0.12%) SAS
12 1 (0.12%) Totara
Applications
1 71 (8.28%) Microsoft Excel
2 41 (4.78%) Microsoft PowerPoint
3 32 (3.73%) Photoshop
4 20 (2.33%) Microsoft Office
5 19 (2.22%) Adobe Illustrator
6 18 (2.10%) Adobe Creative Suite
7 17 (1.98%) InDesign
8 12 (1.40%) Trello
9 10 (1.17%) Adobe Premiere
10 9 (1.05%) Chatbot
11 4 (0.47%) Adobe After Effects
11 4 (0.47%) Microsoft Project
11 4 (0.47%) Notion
12 3 (0.35%) Adobe XD
13 2 (0.23%) CINEMA 4D
13 2 (0.23%) MS Visio
13 2 (0.23%) Spreadsheet
14 1 (0.12%) Blender
14 1 (0.12%) SPSS
Business Applications
1 31 (3.62%) Dynamics CRM
2 30 (3.50%) Shopify
3 21 (2.45%) Academy Revenues and Benefits
4 5 (0.58%) Adobe Campaign
5 4 (0.47%) Dynamics AX
5 4 (0.47%) Oracle EBS
6 3 (0.35%) Magento
7 2 (0.23%) Odoo
7 2 (0.23%) Raiser’s Edge
8 1 (0.12%) Dynamics NAV
8 1 (0.12%) Maximo
8 1 (0.12%) Oracle ERP
8 1 (0.12%) Salesforce CRM
8 1 (0.12%) SAP S/4HANA
Cloud Services
1 102 (11.90%) Google Analytics
2 88 (10.27%) AWS
3 60 (7.00%) Google Ads
3 60 (7.00%) Power Platform
4 50 (5.83%) GitHub
5 49 (5.72%) Azure
6 47 (5.48%) Serverless
7 45 (5.25%) AWS Lambda
7 45 (5.25%) SaaS
8 44 (5.13%) Amazon S3
9 36 (4.20%) Amazon Kinesis
9 36 (4.20%) Amazon SQS
10 31 (3.62%) Dynamics 365
11 29 (3.38%) Google Tag Manager
12 23 (2.68%) PowerApps
13 22 (2.57%) Microsoft 365
14 17 (1.98%) Canva
15 15 (1.75%) OCI
16 14 (1.63%) Microsoft Advertising
17 11 (1.28%) Kontent
Communications & Networking
1 21 (2.45%) WPA
2 10 (1.17%) WAN
3 9 (1.05%) SMS
4 8 (0.93%) 5G
4 8 (0.93%) SD-WAN
5 6 (0.70%) Internet
5 6 (0.70%) Network Security
5 6 (0.70%) Wi-Fi
6 5 (0.58%) Broadband
6 5 (0.58%) DNS
6 5 (0.58%) Intranet
7 4 (0.47%) Firewall
7 4 (0.47%) Unified Communications
7 4 (0.47%) VPN
7 4 (0.47%) Wireless
8 3 (0.35%) DHCP
8 3 (0.35%) Ethernet
9 2 (0.23%) Intrusion Detection
9 2 (0.23%) IP Telephony
9 2 (0.23%) TCP/IP
Database & Business Intelligence
1 51 (5.95%) Big Data
2 45 (5.25%) PostgreSQL
3 39 (4.55%) Redis
4 38 (4.43%) DynamoDB
5 37 (4.32%) Power BI
6 33 (3.85%) Tableau
7 13 (1.52%) Looker
7 13 (1.52%) SQL Server
8 11 (1.28%) Data Warehouse
9 9 (1.05%) MySQL
10 8 (0.93%) Power Query
11 7 (0.82%) Tick Data
12 5 (0.58%) Relational Database
12 5 (0.58%) SQL Server Reporting Services
13 4 (0.47%) Amazon Athena
13 4 (0.47%) Azure SQL Database
13 4 (0.47%) NoSQL
13 4 (0.47%) Oracle ODI
13 4 (0.47%) Parquet
13 4 (0.47%) PowerPivot
Development Applications
1 41 (4.78%) Jenkins
2 35 (4.08%) JIRA
3 22 (2.57%) Git
4 15 (1.75%) Visual Studio
5 6 (0.70%) GitLab
6 4 (0.47%) Bazaar
7 3 (0.35%) Axure RP
7 3 (0.35%) Balsamiq
7 3 (0.35%) Jasmine
7 3 (0.35%) Mocha
7 3 (0.35%) MSBuild
7 3 (0.35%) PHPUnit
7 3 (0.35%) webpack
8 1 (0.12%) Cypress.io
8 1 (0.12%) Maven
8 1 (0.12%) Oracle APEX
8 1 (0.12%) Oracle Forms
8 1 (0.12%) RSpec
8 1 (0.12%) TeamCity
8 1 (0.12%) Visual Studio Tools for Office
General
1 396 (46.21%) Social Skills
2 221 (25.79%) Analytical Skills
3 193 (22.52%) Advertising
4 162 (18.90%) Finance
5 87 (10.15%) Inclusion and Diversity
6 86 (10.04%) Retail
7 73 (8.52%) Presentation Skills
8 66 (7.70%) Public Sector
9 64 (7.47%) Manufacturing
10 55 (6.42%) Organisational Skills
11 51 (5.95%) Telecoms
12 47 (5.48%) Electronics
13 32 (3.73%) Publishing
14 26 (3.03%) Local Government
15 18 (2.10%) Influencing Skills
16 16 (1.87%) Legal
17 13 (1.52%) Games
17 13 (1.52%) Police
18 11 (1.28%) Brand Awareness
19 9 (1.05%) Pharmaceutical
Job Titles
1 123 (14.35%) Senior
2 95 (11.09%) Account Manager
3 68 (7.93%) Developer
4 59 (6.88%) Senior Manager
5 56 (6.53%) Analyst
6 51 (5.95%) Senior Account Manager
7 49 (5.72%) Business Manager
8 47 (5.48%) Software Engineer
9 43 (5.02%) Development Manager
10 40 (4.67%) Business Development Manager
11 34 (3.97%) Strategic Account Manager
12 28 (3.27%) Lead
13 24 (2.80%) PPC Executive
14 23 (2.68%) Senior Analyst
15 22 (2.57%) Consultant
15 22 (2.57%) Project Manager
16 20 (2.33%) Architect
16 20 (2.33%) Marketing Executive
16 20 (2.33%) Web Manager
17 19 (2.22%) Product Manager
Libraries, Frameworks & Software Standards
1 55 (6.42%) HTML
1 55 (6.42%) React
2 49 (5.72%) Node.js
3 46 (5.37%) CSS
4 42 (4.90%) AngularJS
5 40 (4.67%) REST
6 39 (4.55%) Tailwind CSS
7 20 (2.33%) .NET
8 9 (1.05%) JSON
8 9 (1.05%) Next.js
8 9 (1.05%) Vue
8 9 (1.05%) Web Services
9 7 (0.82%) Sass
10 6 (0.70%) HTML5 Canvas
10 6 (0.70%) XML
11 5 (0.58%) CSS3
11 5 (0.58%) Django
11 5 (0.58%) LESS
12 4 (0.47%) Express.js
12 4 (0.47%) Flask
Miscellaneous
1 129 (15.05%) Digital Media
2 122 (14.24%) Social Media
3 100 (11.67%) Marketing Technology
4 77 (8.98%) Product Ownership
5 74 (8.63%) Blog
6 24 (2.80%) Analytical Mindset
7 22 (2.57%) PMI
7 22 (2.57%) Self-Motivation
8 21 (2.45%) Algorithms
9 20 (2.33%) Management Information System
10 15 (1.75%) Mobile App
11 13 (1.52%) Life Science
12 12 (1.40%) Graphic Design
13 10 (1.17%) Cloud Native
14 8 (0.93%) GNSS
14 8 (0.93%) Self-Driving Car
15 7 (0.82%) Animation
15 7 (0.82%) Onboarding
15 7 (0.82%) Reinsurance
16 6 (0.70%) Video Editing
Operating Systems
1 29 (3.38%) Windows
2 21 (2.45%) Windows Vista
3 11 (1.28%) Linux
4 7 (0.82%) Windows Server
5 2 (0.23%) Android
5 2 (0.23%) Apple iOS
6 1 (0.12%) Robot Operating System
6 1 (0.12%) Unix
6 1 (0.12%) Windows Server 2019
Processes & Methodologies
1 286 (33.37%) Digital Marketing
2 206 (24.04%) Analytics
2 206 (24.04%) Project Management
3 176 (20.54%) CRM
4 165 (19.25%) Agile
5 151 (17.62%) Problem-Solving
6 128 (14.94%) Marketing Strategy
7 126 (14.70%) User Experience
8 123 (14.35%) Collaborative Working
9 122 (14.24%) E-Commerce
10 116 (13.54%) Continuous Improvement
11 115 (13.42%) Business Intelligence
12 110 (12.84%) SEO
13 109 (12.72%) Strategic Thinking
14 104 (12.14%) Artificial Intelligence
15 97 (11.32%) Roadmaps
16 95 (11.09%) Time Management
17 85 (9.92%) Epics
18 84 (9.80%) Mentoring
19 77 (8.98%) Business Development
Programming Languages
1 68 (7.93%) SQL
2 63 (7.35%) Python
3 49 (5.72%) JavaScript
4 44 (5.13%) TypeScript
5 23 (2.68%) C#
6 13 (1.52%) C++
7 11 (1.28%) PHP
8 9 (1.05%) C
8 9 (1.05%) R
9 8 (0.93%) Java
10 6 (0.70%) Bash
11 5 (0.58%) PowerShell
12 4 (0.47%) Apex Code
12 4 (0.47%) Perl
13 3 (0.35%) PL/SQL
14 2 (0.23%) Go
14 2 (0.23%) Kotlin
14 2 (0.23%) Ruby
14 2 (0.23%) T-SQL
15 1 (0.12%) Rust
Qualifications
1 119 (13.89%) Degree
2 55 (6.42%) Security Cleared
3 48 (5.60%) DBS Check
4 31 (3.62%) SC Cleared
5 28 (3.27%) DV Cleared
6 24 (2.80%) PMI Certification
7 16 (1.87%) Microsoft Certification
8 11 (1.28%) Master's Degree
9 8 (0.93%) Computer Science Degree
10 6 (0.70%) Numerate Degree
11 5 (0.58%) CSPO
12 4 (0.47%) BPSS Clearance
13 3 (0.35%) AWS Certification
13 3 (0.35%) Azure Certification
13 3 (0.35%) CHECK Team Leader
13 3 (0.35%) CHECK Team Member
13 3 (0.35%) CISSP
13 3 (0.35%) CREST Certified
13 3 (0.35%) OSCP
14 2 (0.23%) PMP
Quality Assurance & Compliance
1 28 (3.27%) QA
2 27 (3.15%) Accessibility
3 21 (2.45%) GDPR
4 9 (1.05%) PMO
5 8 (0.93%) ISO/IEC 27001
6 6 (0.70%) Actionable Recommendations
6 6 (0.70%) NIST
6 6 (0.70%) WCAG
7 4 (0.47%) 21 CFR Part 11
7 4 (0.47%) Data Quality
8 3 (0.35%) Cyber Essentials
8 3 (0.35%) Cyber Essentials PLUS
8 3 (0.35%) GRC
8 3 (0.35%) PCI DSS
9 2 (0.23%) GMP
9 2 (0.23%) Good Clinical Practice
9 2 (0.23%) IEC 62304
9 2 (0.23%) ISO 13485
9 2 (0.23%) ISO 9001
9 2 (0.23%) PERC
System Software
1 49 (5.72%) Docker
2 7 (0.82%) Active Directory
3 2 (0.23%) Virtual Machines
3 2 (0.23%) VMware Infrastructure
4 1 (0.12%) VMware ESXi
4 1 (0.12%) vSphere
Systems Management
1 47 (5.48%) Kubernetes
2 7 (0.82%) Terraform
3 5 (0.58%) Systems Management Server (SMS)
4 4 (0.47%) Ansible
5 3 (0.35%) Prometheus
6 2 (0.23%) Microsoft Intune
6 2 (0.23%) Single Sign-On
7 1 (0.12%) cPanel
7 1 (0.12%) Grafana
7 1 (0.12%) Matomo
7 1 (0.12%) vCenter Server
Vendors
1 154 (17.97%) Microsoft
2 148 (17.27%) Google
3 73 (8.52%) Salesforce
4 57 (6.65%) SAP
5 44 (5.13%) Adobe
6 31 (3.62%) TikTok
7 25 (2.92%) Oracle
8 23 (2.68%) Pinterest
9 22 (2.57%) HubSpot
10 21 (2.45%) Screaming Frog
11 18 (2.10%) Cisco
12 16 (1.87%) Facebook
13 15 (1.75%) Dell
14 13 (1.52%) Ahrefs
15 12 (1.40%) Instagram
16 11 (1.28%) Databricks
17 10 (1.17%) Sitecore
18 9 (1.05%) Salesforce Marketing Cloud
18 9 (1.05%) YouTube
19 8 (0.93%) PayPal