Lead Jobs with Work from Home Options

Leader
UK > Work from Home

The median Leader salary for remote or hybrid work is £75,000 per year, according to job vacancies posted during the 6 months leading to 26 July 2024.

The table below provides salary benchmarking and summary statistics, comparing them to the same period in the previous two years.

6 months to
26 Jul 2024
Same period 2023 Same period 2022
Rank 15 28 41
Rank change year-on-year +13 +13 -7
Permanent jobs requiring a Lead 2,955 2,755 6,035
As % of all permanent jobs with a WFH option 10.58% 8.39% 7.69%
As % of the Job Titles category 10.99% 8.76% 7.92%
Number of salaries quoted 2,288 2,286 3,512
10th Percentile £46,250 £48,000 £48,750
25th Percentile £55,188 £59,750 £60,000
Median annual salary (50th Percentile) £75,000 £70,476 £75,000
Median % change year-on-year +6.42% -6.03% +10.29%
75th Percentile £90,000 £90,000 £92,500
90th Percentile £115,000 £107,500 £108,750
UK median annual salary £70,000 £72,500 £72,500
% change year-on-year -3.45% - +3.57%

All Permanent IT Job Vacancies
Work from Home

For comparison with the information above, the following table provides summary statistics for all permanent IT job vacancies with WFH or hybrid options. Most job vacancies include a discernible job title that can be normalized. As such, the figures in the second row provide an indication of the number of permanent jobs in our overall sample.

Permanent vacancies in Work from Home with a recognized job title 26,891 31,453 76,163
% of permanent jobs with a recognized job title 96.26% 95.84% 96.99%
Number of salaries quoted 19,582 23,849 44,441
10th Percentile £34,500 £36,750 £36,250
25th Percentile £42,500 £46,749 £45,750
Median annual salary (50th Percentile) £57,500 £62,500 £60,000
Median % change year-on-year -8.00% +4.17% +9.09%
75th Percentile £75,728 £80,000 £80,000
90th Percentile £95,000 £100,000 £95,000
UK median annual salary £55,000 £60,000 £60,000
% change year-on-year -8.33% - +9.09%

Lead
Trend for Jobs with a WFH Option

Job vacancies with a work from home option which featured Lead in the job title as a proportion of all IT jobs advertised.
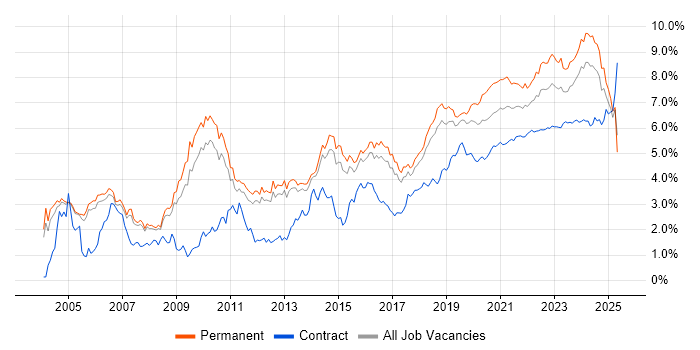
Lead trend for jobs with a WFH option

Lead
Salary Trend for Jobs with a WFH Option

3-month moving average salary quoted in job vacancies with a work from home option citing Lead.

Lead salary trend for jobs with a WFH option

Lead
Salary Histogram for Jobs with a WFH Option

Salary distribution for jobs with a work from home option citing Lead over the 6 months to 26 July 2024.

Lead salary histogram for jobs with a WFH option

Lead Skill Set
Top 30 Co-occurring Skills and Capabilities in Job Vacancies with WFH Options

For the 6 months to 26 July 2024, Lead job roles required the following skills and capabilities in order of popularity. The figures indicate the absolute number co-occurrences and as a proportion of all permanent jobs with remote work options featuring Lead in the job title.

1 860 (29.10%) Agile
2 711 (24.06%) AWS
3 632 (21.39%) Finance
4 623 (21.08%) Azure
5 607 (20.54%) Mentoring
6 536 (18.14%) Social Skills
7 468 (15.84%) Python
8 434 (14.69%) Software Engineering
9 424 (14.35%) Coaching
10 400 (13.54%) Microsoft
11 388 (13.13%) Java
12 380 (12.86%) JavaScript
13 372 (12.59%) SQL
14 340 (11.51%) Analytics
15 317 (10.73%) TypeScript
15 317 (10.73%) Problem-Solving
16 279 (9.44%) Security Cleared
17 269 (9.10%) DevOps
18 268 (9.07%) Roadmaps
19 263 (8.90%) Process Improvement
20 256 (8.66%) Banking
21 248 (8.39%) dbt
22 245 (8.29%) Marketing
22 245 (8.29%) .NET
22 245 (8.29%) Line Management
23 235 (7.95%) Degree
24 232 (7.85%) C#
25 222 (7.51%) Data Lake
26 211 (7.14%) Data Strategy
27 209 (7.07%) Retail

Lead Skill Set
Co-occurring Skills and Capabilities with WFH Options by Category

The follow tables expand on the table above by listing co-occurrences grouped by category. The same employment type, locality and period is covered with up to 20 co-occurrences shown in each of the following categories:

Application Platforms
1 205 (6.94%) Apache Airflow
2 199 (6.73%) Apache
3 46 (1.56%) WebLogic
4 44 (1.49%) SharePoint
5 36 (1.22%) Confluence
6 30 (1.02%) Tuxedo
7 29 (0.98%) Microsoft Exchange
8 26 (0.88%) IIS
9 11 (0.37%) CMS
10 10 (0.34%) Apache Spark
10 10 (0.34%) OpenStack
11 9 (0.30%) Appian
11 9 (0.30%) SAS
12 6 (0.20%) WordPress
13 5 (0.17%) Apache Solr
14 3 (0.10%) Drupal
14 3 (0.10%) Umbraco
15 2 (0.068%) MQSeries
16 1 (0.034%) nginx
16 1 (0.034%) OpenEdge
Applications
1 42 (1.42%) Microsoft Office
2 25 (0.85%) Microsoft Excel
3 13 (0.44%) Microsoft PowerPoint
4 6 (0.20%) Microsoft Project
4 6 (0.20%) Simulink
5 4 (0.14%) MS Visio
5 4 (0.14%) Spreadsheet
6 2 (0.068%) Adobe Creative Suite
6 2 (0.068%) Adobe Illustrator
6 2 (0.068%) Adobe XD
6 2 (0.068%) Chatbot
6 2 (0.068%) Photoshop
7 1 (0.034%) Abaqus
7 1 (0.034%) Adobe After Effects
7 1 (0.034%) Adobe Premiere
7 1 (0.034%) Blender
7 1 (0.034%) CATIA
7 1 (0.034%) InDesign
7 1 (0.034%) Sketch
7 1 (0.034%) Trello
Business Applications
1 67 (2.27%) Dynamics CRM
2 46 (1.56%) Sparx Enterprise Architect
3 18 (0.61%) SAP S/4HANA
4 5 (0.17%) Oracle General Ledger
4 5 (0.17%) Oracle Subledger Accounting
4 5 (0.17%) SAP HR
4 5 (0.17%) SAP Payroll
5 4 (0.14%) Primavera
5 4 (0.14%) Salesforce CRM
5 4 (0.14%) Shopify
6 3 (0.10%) OpenText VIM for SAP
6 3 (0.10%) SAP CO
6 3 (0.10%) SAP FI
6 3 (0.10%) SAP FI/CO
6 3 (0.10%) SAP SD
7 2 (0.068%) iTrent
7 2 (0.068%) Workday HCM
8 1 (0.034%) Aladdin
8 1 (0.034%) SAP GTS
8 1 (0.034%) SAP MDG
Cloud Services
1 711 (24.06%) AWS
2 623 (21.08%) Azure
3 248 (8.39%) dbt
4 208 (7.04%) Snowflake
5 206 (6.97%) GCP
6 131 (4.43%) Power Platform
7 123 (4.16%) Microsoft 365
8 115 (3.89%) SaaS
9 102 (3.45%) Amazon EKS
10 99 (3.35%) Serverless
11 97 (3.28%) Azure DevOps
12 82 (2.77%) Dynamics 365
13 77 (2.61%) Amazon SQS
14 66 (2.23%) AWS Lambda
15 63 (2.13%) Amazon ECS
16 45 (1.52%) Amazon EC2
17 40 (1.35%) Amazon S3
18 32 (1.08%) Entra ID
18 32 (1.08%) PowerApps
19 30 (1.02%) GitHub
Communications & Networking
1 191 (6.46%) Broadband
2 105 (3.55%) Firewall
3 89 (3.01%) DNS
4 85 (2.88%) TCP/IP
5 70 (2.37%) SSL
6 57 (1.93%) WAN
7 50 (1.69%) BGP
8 33 (1.12%) Wireless
9 31 (1.05%) LAN
9 31 (1.05%) SD-WAN
10 24 (0.81%) VPN
11 22 (0.74%) Wi-Fi
12 20 (0.68%) Intrusion Detection
13 18 (0.61%) Network Security
14 16 (0.54%) Internet
15 13 (0.44%) Ethernet
16 12 (0.41%) DHCP
17 11 (0.37%) VLAN
18 10 (0.34%) HTTP
19 7 (0.24%) VoIP
Database & Business Intelligence
1 222 (7.51%) Data Lake
2 201 (6.80%) Amazon Athena
3 197 (6.67%) Apache Arrow
3 197 (6.67%) Dremio
4 194 (6.57%) Apache Ignite
5 137 (4.64%) SQL Server
6 109 (3.69%) Power BI
7 87 (2.94%) Tableau
8 85 (2.88%) Relational Database
9 63 (2.13%) Amazon RDS
10 48 (1.62%) Oracle Database
10 48 (1.62%) RDBMS
11 46 (1.56%) Data Warehouse
12 36 (1.22%) MySQL
13 32 (1.08%) MongoDB
14 30 (1.02%) DynamoDB
15 25 (0.85%) NoSQL
15 25 (0.85%) PostgreSQL
16 22 (0.74%) DB2
17 18 (0.61%) SQL Server Reporting Services
Development Applications
1 108 (3.65%) Git
2 58 (1.96%) GitLab
3 56 (1.90%) JIRA
4 39 (1.32%) Jenkins
5 30 (1.02%) Visual Studio
6 28 (0.95%) Selenium
7 24 (0.81%) Postman
8 16 (0.54%) TeamCity
9 15 (0.51%) Team Foundation Server
10 14 (0.47%) Cucumber
11 12 (0.41%) Subversion
12 11 (0.37%) Cypress.io
13 10 (0.34%) SpecFlow
14 9 (0.30%) NUnit
14 9 (0.30%) SoapUI
15 8 (0.27%) Jasmine
15 8 (0.27%) JMeter
16 7 (0.24%) Octopus Deploy
16 7 (0.24%) Visual Studio Code
17 5 (0.17%) Rational DOORS
General
1 632 (21.39%) Finance
2 536 (18.14%) Social Skills
3 256 (8.66%) Banking
4 245 (8.29%) Marketing
5 209 (7.07%) Retail
6 206 (6.97%) Analytical Skills
7 201 (6.80%) Front Office
8 197 (6.67%) Investment Banking
9 191 (6.46%) Advertising
10 165 (5.58%) Public Sector
11 138 (4.67%) Inclusion and Diversity
12 109 (3.69%) Legal
13 65 (2.20%) Presentation Skills
14 54 (1.83%) Automotive
15 47 (1.59%) Law
16 46 (1.56%) Telecoms
17 39 (1.32%) Manufacturing
18 32 (1.08%) Influencing Skills
19 28 (0.95%) Organisational Skills
20 22 (0.74%) Local Government
Libraries, Frameworks & Software Standards
1 245 (8.29%) .NET
2 197 (6.67%) gRPC
2 197 (6.67%) Protocol Buffers
3 195 (6.60%) NumPy
3 195 (6.60%) Pandas
3 195 (6.60%) SciPy
4 142 (4.81%) React
5 108 (3.65%) HTML
6 92 (3.11%) Node.js
7 88 (2.98%) CSS
8 77 (2.61%) RESTful
9 61 (2.06%) Spring Boot
10 58 (1.96%) PySpark
11 57 (1.93%) .NET Core
11 57 (1.93%) RabbitMQ
12 48 (1.62%) Vue
13 47 (1.59%) ASP.NET
13 47 (1.59%) REST
14 45 (1.52%) AngularJS
15 43 (1.46%) .NET Framework
Miscellaneous
1 203 (6.87%) Derivative
2 200 (6.77%) Fixed Income
2 200 (6.77%) Hedge funds
3 197 (6.67%) Equities
4 196 (6.63%) Foreign Exchange (FX)
5 184 (6.23%) Marketing Technology
6 87 (2.94%) Management Information System
7 83 (2.81%) Public Cloud
8 71 (2.40%) Product Ownership
9 62 (2.10%) Enterprise Software
10 49 (1.66%) Cloud Native
11 39 (1.32%) Self-Motivation
12 38 (1.29%) Greenfield Project
12 38 (1.29%) Mobile App
13 34 (1.15%) Private Cloud
14 31 (1.05%) Data Centre
15 28 (0.95%) Distributed Systems
16 25 (0.85%) NHS
17 24 (0.81%) Distributed Denial-of-Service
18 23 (0.78%) Virtual Team
Operating Systems
1 154 (5.21%) Windows
2 123 (4.16%) Linux
3 54 (1.83%) Windows Server
4 49 (1.66%) Red Hat Enterprise Linux
5 28 (0.95%) Windows 10
6 18 (0.61%) Android
7 16 (0.54%) Apple iOS
8 15 (0.51%) zOS
9 14 (0.47%) Unix
10 10 (0.34%) Windows Server 2016
11 9 (0.30%) CentOS
11 9 (0.30%) Ubuntu
12 8 (0.27%) Solaris
12 8 (0.27%) Windows Server 2019
13 6 (0.20%) Windows Server 2012
14 5 (0.17%) Mac OS
14 5 (0.17%) VMS
14 5 (0.17%) Windows 7
15 1 (0.034%) Debian
15 1 (0.034%) Embedded Linux
Processes & Methodologies
1 860 (29.10%) Agile
2 607 (20.54%) Mentoring
3 434 (14.69%) Software Engineering
4 424 (14.35%) Coaching
5 340 (11.51%) Analytics
6 317 (10.73%) Problem-Solving
7 269 (9.10%) DevOps
8 268 (9.07%) Roadmaps
9 263 (8.90%) Process Improvement
10 245 (8.29%) Line Management
11 211 (7.14%) Data Strategy
12 208 (7.04%) Business Case
13 206 (6.97%) Asset Management
14 202 (6.84%) Project Management
15 197 (6.67%) Use Case
16 195 (6.60%) CI/CD
17 194 (6.57%) Continuous Improvement
17 194 (6.57%) Data Collection
18 192 (6.50%) Regulatory Change
19 191 (6.46%) Digital Marketing
Programming Languages
1 468 (15.84%) Python
2 388 (13.13%) Java
3 380 (12.86%) JavaScript
4 372 (12.59%) SQL
5 317 (10.73%) TypeScript
6 232 (7.85%) C#
7 59 (2.00%) COBOL
7 59 (2.00%) Micro Focus COBOL
8 57 (1.93%) C
9 56 (1.90%) C++
10 36 (1.22%) PowerShell
11 33 (1.12%) PHP
12 19 (0.64%) XAML
13 18 (0.61%) Scala
14 17 (0.58%) Go
15 15 (0.51%) T-SQL
16 14 (0.47%) Kotlin
17 12 (0.41%) Bash
17 12 (0.41%) R
18 10 (0.34%) Julia
Qualifications
1 279 (9.44%) Security Cleared
2 235 (7.95%) Degree
3 179 (6.06%) SC Cleared
4 93 (3.15%) Azure Certification
5 86 (2.91%) AWS Certification
6 56 (1.90%) Computer Science Degree
7 55 (1.86%) DBS Check
8 49 (1.66%) CISM
9 46 (1.56%) AWS Certified Solutions Architect
9 46 (1.56%) CISSP
10 28 (0.95%) Cisco Certification
11 27 (0.91%) DV Cleared
12 24 (0.81%) (ISC)2 CCSP
12 24 (0.81%) BPSS Clearance
12 24 (0.81%) CCSK
12 24 (0.81%) CCSP
13 18 (0.61%) CISA
13 18 (0.61%) Microsoft Certification
14 15 (0.51%) Master's Degree
15 14 (0.47%) CRISC
Quality Assurance & Compliance
1 161 (5.45%) QA
2 127 (4.30%) Data Quality
3 46 (1.56%) ISO/IEC 27001
4 31 (1.05%) Accessibility
4 31 (1.05%) NIST
5 29 (0.98%) SLA
6 28 (0.95%) GDPR
7 17 (0.58%) GRC
8 14 (0.47%) Cyber Essentials
9 13 (0.44%) NCSC
10 12 (0.41%) ISO 9001
10 12 (0.41%) PMO
11 8 (0.27%) HL7
12 6 (0.20%) Cyber Essentials PLUS
12 6 (0.20%) WCAG
13 5 (0.17%) GAAP
13 5 (0.17%) IFRS
13 5 (0.17%) JSP 440
13 5 (0.17%) PCI DSS
13 5 (0.17%) RMADS
System Software
1 138 (4.67%) Docker
2 64 (2.17%) Active Directory
3 22 (0.74%) VMware Infrastructure
4 21 (0.71%) Virtual Machines
5 13 (0.44%) Hyper-V
6 9 (0.30%) Virtual Desktop
7 6 (0.20%) Firmware
7 6 (0.20%) VMware ESXi
8 2 (0.068%) XenDesktop
9 1 (0.034%) Embedded Firmware
9 1 (0.034%) KVM
Systems Management
1 147 (4.97%) Kubernetes
2 98 (3.32%) Terraform
3 31 (1.05%) Ansible
4 30 (1.02%) Single Sign-On
5 23 (0.78%) Microsoft Intune
6 22 (0.74%) Puppet
7 13 (0.44%) Grafana
8 11 (0.37%) Prometheus
9 10 (0.34%) ZABBIX
10 8 (0.27%) vCenter Server
11 7 (0.24%) MIIS
11 7 (0.24%) SCCM
11 7 (0.24%) SysTrack
12 6 (0.20%) Consul
12 6 (0.20%) Progress Chef
13 4 (0.14%) Autotask
13 4 (0.14%) Microsoft Clustering
13 4 (0.14%) WSUS
14 3 (0.10%) Nessus
15 2 (0.068%) QRadar
Vendors
1 400 (13.54%) Microsoft
2 117 (3.96%) Oracle
3 74 (2.50%) Databricks
4 59 (2.00%) Micro Focus
5 51 (1.73%) SAP
6 50 (1.69%) ServiceNow
7 49 (1.66%) Google
8 46 (1.56%) Sparx
9 37 (1.25%) VMware
10 30 (1.02%) Bloomberg
10 30 (1.02%) Reuters
11 27 (0.91%) IBM
12 21 (0.71%) Cisco
13 20 (0.68%) Salesforce
14 17 (0.58%) Atlassian
15 15 (0.51%) Splunk
16 14 (0.47%) ForgeRock
16 14 (0.47%) Sitecore
17 9 (0.30%) Citrix
18 7 (0.24%) Sophos