Hybrid/Remote Machine Learning Job Trends

Machine Learning (ML)
UK > Work from Home

The table below provides summary statistics and salary benchmarking for remote or hybrid work requiring Machine Learning skills. It covers permanent job vacancies from the 6 months leading up to 25 November 2025, with comparisons to the same periods in the previous two years.

6 months to
25 Nov 2025
Same period 2024 Same period 2023
Rank 115 74 90
Rank change year-on-year -41 +16 +4
Permanent jobs citing Machine Learning 349 773 732
As % of all permanent jobs with remote/hybrid work options 2.30% 3.89% 3.45%
As % of the Processes & Methodologies category 2.53% 4.33% 3.64%
Number of salaries quoted 251 434 474
10th Percentile £46,250 £42,875 £45,000
25th Percentile £56,250 £54,000 £53,750
Median annual salary (50th Percentile) £80,000 £70,000 £70,452
Median % change year-on-year +14.29% -0.64% -2.82%
75th Percentile £100,000 £85,000 £87,480
90th Percentile £132,500 £101,750 £100,000
UK median annual salary £80,000 £77,000 £75,000
% change year-on-year +3.90% +2.67% +7.14%

All Process and Methodology Skills
Work from Home

Machine Learning falls under the Processes and Methodologies category. For comparison with the information above, the following table provides summary statistics for all permanent job vacancies with remote or hybrid options requiring process or methodology skills.

Permanent vacancies with a requirement for process or methodology skills 13,820 17,850 20,123
As % of all permanent jobs with a WFH option 90.98% 89.77% 94.97%
Number of salaries quoted 8,725 10,738 16,290
10th Percentile £29,500 £36,250 £36,500
25th Percentile £40,000 £46,250 £46,306
Median annual salary (50th Percentile) £57,500 £62,500 £62,500
Median % change year-on-year -8.00% - -
75th Percentile £77,500 £81,250 £80,000
90th Percentile £97,500 £100,000 £97,500
UK median annual salary £55,000 £60,000 £60,000
% change year-on-year -8.33% - -

Machine Learning
Job Vacancy Trend for Remote/Hybrid Jobs

Historical trend showing the proportion of permanent IT job postings citing Machine Learning and offering remote or hybrid work options relative to all permanent IT jobs advertised.
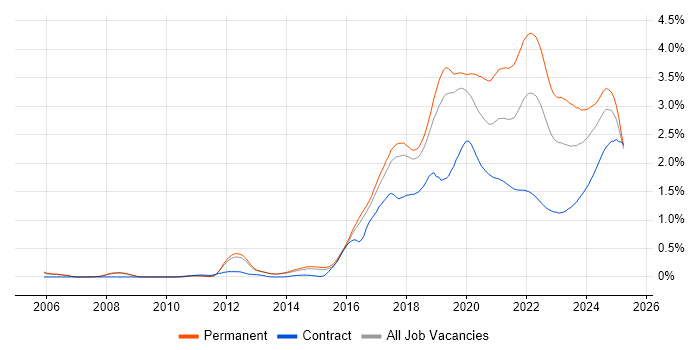
Machine Learning job vacancy trend for remote/hybrid jobs

Machine Learning
Salary Trend for Remote/Hybrid Jobs

Salary distribution trend for jobs with remote/hybrid work options citing Machine Learning.

Salary distribution trend for jobs with remote/hybrid work options citing Machine Learning

Machine Learning
Salary Histogram for Remote/Hybrid Jobs

Salary distribution for jobs with remote/hybrid work options citing Machine Learning over the 6 months to 25 November 2025.

Machine Learning salary histogram for jobs with remote/hybrid work options

Machine Learning
Co-Occurring Skills & Capabilities in Remote/Hybrid Jobs by Category

The following tables expand on the one above by listing co-occurrences grouped by category. They cover the same employment type, locality and period, with up to 20 co-occurrences shown in each category:

Application Platforms
1 16 (4.58%) Apache Spark
2 13 (3.72%) Apache Airflow
3 8 (2.29%) Microsoft Exchange
3 8 (2.29%) SharePoint
4 7 (2.01%) Apache Solr
5 4 (1.15%) Apache Pulsar
5 4 (1.15%) CMS
5 4 (1.15%) Confluence
6 3 (0.86%) Apache
7 2 (0.57%) Luigi
7 2 (0.57%) SAS
8 1 (0.29%) ArcGIS
Applications
1 11 (3.15%) Microsoft Excel
2 6 (1.72%) Chatbot
3 3 (0.86%) Microsoft Office
3 3 (0.86%) Spreadsheet
3 3 (0.86%) Trello
4 2 (0.57%) Adobe XD
4 2 (0.57%) Microsoft PowerPoint
4 2 (0.57%) Sketch
4 2 (0.57%) Weka
5 1 (0.29%) 3ds Max
5 1 (0.29%) Blender
Business Applications
1 6 (1.72%) Adaptiv
1 6 (1.72%) Dynamics CRM
2 4 (1.15%) SAP S/4HANA
3 3 (0.86%) SAP SCM
4 1 (0.29%) NetSuite
4 1 (0.29%) SAP APO
4 1 (0.29%) SAP EWM
4 1 (0.29%) SAP IBP
4 1 (0.29%) SAP LE
4 1 (0.29%) SAP MM
4 1 (0.29%) SAP PP
4 1 (0.29%) SAP QM
4 1 (0.29%) SAP SD
Cloud Services
1 159 (45.56%) Azure
2 109 (31.23%) AWS
3 54 (15.47%) GCP
4 35 (10.03%) Power Platform
5 29 (8.31%) Microsoft 365
6 26 (7.45%) Entra ID
7 24 (6.88%) SaaS
8 18 (5.16%) Azure DevOps
8 18 (5.16%) Serverless
9 16 (4.58%) Azure Machine Learning
10 14 (4.01%) Amazon S3
10 14 (4.01%) AWS Lambda
11 13 (3.72%) GitHub
12 12 (3.44%) Microsoft Purview
13 11 (3.15%) Azure Data Factory
13 11 (3.15%) PaaS
14 10 (2.87%) Azure Monitor
15 9 (2.58%) Amazon ECS
15 9 (2.58%) Azure Synapse Analytics
16 8 (2.29%) Mimecast
Communications & Networking
1 4 (1.15%) Broadband
2 3 (0.86%) Kerberos
3 2 (0.57%) InfiniBand
4 1 (0.29%) SAN
Database & Business Intelligence
1 32 (9.17%) Power BI
2 28 (8.02%) Data Warehouse
3 16 (4.58%) NoSQL
4 13 (3.72%) PostgreSQL
4 13 (3.72%) SQL Server
4 13 (3.72%) Tableau
5 11 (3.15%) Big Data
5 11 (3.15%) Data Lake
5 11 (3.15%) Elasticsearch
6 10 (2.87%) MySQL
7 9 (2.58%) MongoDB
8 8 (2.29%) Amazon Redshift
8 8 (2.29%) Metadata
9 7 (2.01%) Data Mining
9 7 (2.01%) Relational Database
10 6 (1.72%) Hadoop
10 6 (1.72%) Redis
11 5 (1.43%) Azure SQL Database
11 5 (1.43%) Looker
12 4 (1.15%) Apache Hive
Development Applications
1 20 (5.73%) Git
2 8 (2.29%) JIRA
3 6 (1.72%) MLflow
4 4 (1.15%) Jenkins
5 3 (0.86%) GitLab
5 3 (0.86%) RStudio
5 3 (0.86%) Visual Studio
6 2 (0.57%) ER Studio
6 2 (0.57%) ERwin
6 2 (0.57%) SonarQube
6 2 (0.57%) Sonatype Nexus
7 1 (0.29%) Cypress.io
7 1 (0.29%) PHPUnit
7 1 (0.29%) Vite
General
1 104 (29.80%) Finance
2 102 (29.23%) Social Skills
3 45 (12.89%) Analytical Skills
4 28 (8.02%) Marketing
5 25 (7.16%) Public Sector
5 25 (7.16%) Retail
6 19 (5.44%) Telecoms
7 17 (4.87%) Games
8 15 (4.30%) Banking
9 13 (3.72%) Law
10 11 (3.15%) Inclusion and Diversity
10 11 (3.15%) Manufacturing
11 7 (2.01%) Automotive
11 7 (2.01%) Pharmaceutical
12 6 (1.72%) Legal
13 5 (1.43%) Presentation Skills
14 4 (1.15%) Aerospace
14 4 (1.15%) Billing
14 4 (1.15%) Financial Institution
15 3 (0.86%) Organisational Skills
Job Titles
1 42 (12.03%) Lead
1 42 (12.03%) Senior
2 34 (9.74%) Data Engineer
3 30 (8.60%) Developer
4 25 (7.16%) Architect
5 24 (6.88%) Data Scientist
6 21 (6.02%) Analyst
7 18 (5.16%) Software Engineer
8 15 (4.30%) Artificial Intelligence Engineer
8 15 (4.30%) Consultant
9 10 (2.87%) Product Owner
10 9 (2.58%) Azure Engineer
10 9 (2.58%) Technical Manager
11 8 (2.29%) Business Analyst
11 8 (2.29%) Full-Stack Engineer
11 8 (2.29%) Full-Stack Software Engineer
11 8 (2.29%) Microsoft 365 Engineer
11 8 (2.29%) Python Engineer
12 7 (2.01%) Applications Engineer
12 7 (2.01%) Machine Learning Engineer
Libraries, Frameworks & Software Standards
1 24 (6.88%) Kafka
2 23 (6.59%) React
2 23 (6.59%) TensorFlow
3 22 (6.30%) Node.js
3 22 (6.30%) RESTful
4 21 (6.02%) PyTorch
4 21 (6.02%) scikit-learn
5 17 (4.87%) gRPC
5 17 (4.87%) REST
6 16 (4.58%) Pandas
7 14 (4.01%) Spring
8 13 (3.72%) RabbitMQ
8 13 (3.72%) Spring Boot
9 12 (3.44%) Hugging Face
10 10 (2.87%) .NET
10 10 (2.87%) WebSockets
11 9 (2.58%) FastAPI
11 9 (2.58%) NumPy
12 8 (2.29%) AngularJS
12 8 (2.29%) Middleware
Miscellaneous
1 47 (13.47%) Product Ownership
2 39 (11.17%) Cloud Native
3 24 (6.88%) Distributed Systems
4 18 (5.16%) Algorithms
5 17 (4.87%) AI Agents
6 11 (3.15%) Reinsurance
7 9 (2.58%) Credit Risk
8 8 (2.29%) Augmented Reality
8 8 (2.29%) Driving Licence
8 8 (2.29%) Security Posture
9 7 (2.01%) Onboarding
10 6 (1.72%) CUDA
10 6 (1.72%) Legacy Systems
10 6 (1.72%) Market Risk
10 6 (1.72%) Mobile Games
10 6 (1.72%) Sports Betting
11 5 (1.43%) Data Structures
11 5 (1.43%) Distributed Computing
11 5 (1.43%) Educational Technology
12 4 (1.15%) Low-Code
Operating Systems
1 19 (5.44%) Windows
2 14 (4.01%) Linux
3 13 (3.72%) Android
4 7 (2.01%) Apple iOS
4 7 (2.01%) Windows Server
5 3 (0.86%) Unix
6 2 (0.57%) Mac OS
Processes & Methodologies
1 268 (76.79%) AI
2 144 (41.26%) Analytics
3 95 (27.22%) Data Science
4 93 (26.65%) Agile
5 88 (25.21%) DevOps
6 77 (22.06%) Roadmaps
7 70 (20.06%) CI/CD
8 67 (19.20%) Problem-Solving
9 63 (18.05%) Continuous Improvement
10 52 (14.90%) Decision-Making
10 52 (14.90%) LLM
11 51 (14.61%) Software Engineering
12 47 (13.47%) Business Intelligence
13 42 (12.03%) ITIL
13 42 (12.03%) Natural Language Processing
14 41 (11.75%) Computer Science
15 40 (11.46%) Coaching
16 39 (11.17%) Data Engineering
17 38 (10.89%) Data Pipeline
18 37 (10.60%) Microservices
Programming Languages
1 162 (46.42%) Python
2 83 (23.78%) SQL
3 40 (11.46%) Java
4 28 (8.02%) R
5 27 (7.74%) PowerShell
6 23 (6.59%) Bash
7 21 (6.02%) JavaScript
8 17 (4.87%) TypeScript
9 16 (4.58%) C++
9 16 (4.58%) PHP
10 11 (3.15%) C#
11 10 (2.87%) Go
12 9 (2.58%) Scala
12 9 (2.58%) T-SQL
13 8 (2.29%) Kotlin
14 4 (1.15%) Data Analysis Expressions
14 4 (1.15%) MATLAB
15 2 (0.57%) Bicep
15 2 (0.57%) C
16 1 (0.29%) SystemVerilog
Qualifications
1 70 (20.06%) Degree
2 24 (6.88%) Security Cleared
3 23 (6.59%) Computer Science Degree
4 22 (6.30%) SC Cleared
5 16 (4.58%) Master's Degree
6 11 (3.15%) PMP
7 10 (2.87%) CFA
7 10 (2.87%) PMI Certification
8 7 (2.01%) AWS Certification
8 7 (2.01%) PhD
9 6 (1.72%) ITIL Certification
9 6 (1.72%) Postgraduate
10 5 (1.43%) BPSS Clearance
11 4 (1.15%) Azure Certification
11 4 (1.15%) DBS Check
11 4 (1.15%) Numerate Degree
12 3 (0.86%) Microsoft Certification
13 2 (0.57%) AWS Certified Developer
13 2 (0.57%) CREST Certified
13 2 (0.57%) SnowPro
Quality Assurance & Compliance
1 24 (6.88%) Data Quality
2 13 (3.72%) GDPR
3 5 (1.43%) QA
3 5 (1.43%) Sarbanes-Oxley
4 4 (1.15%) Accessibility
4 4 (1.15%) EU AI Act
4 4 (1.15%) ISO/IEC 27001
5 2 (0.57%) Actionable Recommendations
5 2 (0.57%) ISO 26262
5 2 (0.57%) ISO 9001
5 2 (0.57%) PCI DSS
5 2 (0.57%) SOC 2
6 1 (0.29%) Cyber Essentials
6 1 (0.29%) Cyber Essentials PLUS
6 1 (0.29%) HL7
6 1 (0.29%) ISO 13485
6 1 (0.29%) ISO/IEC 42001
6 1 (0.29%) PMO
System Software
1 46 (13.18%) Docker
2 18 (5.16%) Virtual Desktop
3 11 (3.15%) Active Directory
4 10 (2.87%) Virtual Machines
5 2 (0.57%) Ceph
5 2 (0.57%) Lustre
5 2 (0.57%) Slurm Workload Manager
6 1 (0.29%) Firmware
6 1 (0.29%) VMware Infrastructure
Systems Management
1 49 (14.04%) Kubernetes
2 32 (9.17%) Terraform
3 18 (5.16%) Microsoft Intune
4 16 (4.58%) Ansible
5 8 (2.29%) SCCM
6 2 (0.57%) Argo
6 2 (0.57%) Kubeflow
6 2 (0.57%) Progress Chef
6 2 (0.57%) Puppet
7 1 (0.29%) Grafana
7 1 (0.29%) Istio
7 1 (0.29%) Kustomize
Vendors
1 54 (15.47%) Microsoft
2 31 (8.88%) Databricks
3 20 (5.73%) Google
4 12 (3.44%) OpenAI
5 10 (2.87%) Murex
6 8 (2.29%) Salesforce
7 7 (2.01%) SAP
8 6 (1.72%) FIS
9 5 (1.43%) ServiceNow
10 4 (1.15%) Alteryx
10 4 (1.15%) Ericsson
10 4 (1.15%) Genesys
10 4 (1.15%) HubSpot
10 4 (1.15%) Mavenir
10 4 (1.15%) Nokia
10 4 (1.15%) Talend
10 4 (1.15%) Zoho
11 3 (0.86%) Dell
11 3 (0.86%) Mercator
12 2 (0.57%) Concur