Azure DevOps Jobs with Work from Home Options

Microsoft Azure DevOps
UK > Work from Home

The table below provides summary statistics for permanent remote or hybrid work requiring Azure DevOps skills. It includes a benchmarking guide to the annual salaries offered in vacancies that cited Azure DevOps over the 6 months leading up to 26 July 2024, comparing them to the same period in the previous two years.

6 months to
26 Jul 2024
Same period 2023 Same period 2022
Rank 100 59 89
Rank change year-on-year -41 +30 -3
Permanent jobs citing Azure DevOps 800 1,596 3,299
As % of all permanent jobs with a WFH option 2.86% 4.86% 4.20%
As % of the Cloud Services category 6.92% 10.12% 7.91%
Number of salaries quoted 674 1,065 1,914
10th Percentile £42,500 £42,069 £40,000
25th Percentile £50,000 £51,250 £47,500
Median annual salary (50th Percentile) £60,750 £65,000 £62,500
Median % change year-on-year -6.54% +4.00% +13.64%
75th Percentile £74,938 £80,000 £77,500
90th Percentile £90,000 £94,500 £87,000
UK median annual salary £65,000 £65,000 £63,650
% change year-on-year - +2.12% +10.70%

All Cloud Skills
Work from Home

Azure DevOps falls under the Cloud Services category. For comparison with the information above, the following table provides summary statistics for all permanent job vacancies with remote or hybrid options requiring cloud computing skills.

Permanent vacancies with a requirement for cloud computing skills 11,565 15,776 41,709
As % of all permanent jobs with a WFH option 41.40% 48.07% 53.11%
Number of salaries quoted 9,006 12,359 22,853
10th Percentile £36,250 £37,866 £37,500
25th Percentile £46,250 £48,750 £46,250
Median annual salary (50th Percentile) £62,500 £65,000 £65,000
Median % change year-on-year -3.85% - +8.33%
75th Percentile £83,750 £83,750 £83,750
90th Percentile £107,500 £102,500 £97,132
UK median annual salary £60,000 £62,500 £62,500
% change year-on-year -4.00% - +4.17%

Azure DevOps
Trend for Jobs with a WFH Option

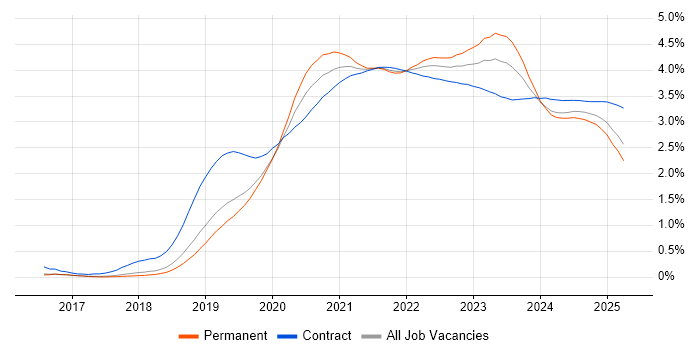
Job vacancies with a work from home option citing Azure DevOps as a proportion of all IT jobs advertised.

Azure DevOps trend for jobs with a WFH option

Azure DevOps
Salary Trend for Jobs with a WFH Option

3-month moving average salary quoted in job vacancies with a work from home option citing Azure DevOps.

Azure DevOps salary trend for jobs with a WFH option

Azure DevOps
Salary Histogram for Jobs with a WFH Option

Salary distribution for jobs with a work from home option citing Azure DevOps over the 6 months to 26 July 2024.

Azure DevOps salary histogram for jobs with a WFH option

Azure DevOps
Co-occurring Skills and Capabilities with WFH Options by Category

The follow tables expand on the table above by listing co-occurrences grouped by category. The same employment type, locality and period is covered with up to 20 co-occurrences shown in each of the following categories:

Application Platforms
1 84 (10.50%) IIS
2 41 (5.13%) SharePoint
3 32 (4.00%) CMS
4 31 (3.88%) Umbraco
5 29 (3.63%) Sitecore CMS
6 28 (3.50%) Confluence
6 28 (3.50%) Kentico
7 26 (3.25%) Headless CMS
8 12 (1.50%) Apache Spark
9 7 (0.88%) Apache Solr
10 4 (0.50%) nginx
11 3 (0.38%) Apache
11 3 (0.38%) Microsoft Exchange
12 2 (0.25%) Moodle
13 1 (0.13%) IBM Notes
13 1 (0.13%) SharePoint Server
Applications
1 14 (1.75%) Microsoft Excel
2 11 (1.38%) Microsoft Office
3 6 (0.75%) Microsoft PowerPoint
3 6 (0.75%) Microsoft Project
4 5 (0.63%) MS Visio
5 2 (0.25%) Trello
6 1 (0.13%) Revit
Business Applications
1 46 (5.75%) Dynamics CRM
2 5 (0.63%) Dynamics NAV
3 4 (0.50%) Elite 3E
4 2 (0.25%) Oracle Applications
5 1 (0.13%) Remedy ITSM
Cloud Services
1 800 (100.00%) Azure
2 133 (16.63%) Power Platform
3 117 (14.63%) AWS
4 83 (10.38%) Dynamics 365
5 76 (9.50%) PaaS
6 73 (9.13%) SaaS
7 60 (7.50%) GitHub
8 52 (6.50%) IaaS
9 51 (6.38%) Azure Logic Apps
10 49 (6.13%) Azure Service Bus
10 49 (6.13%) Serverless
11 48 (6.00%) Azure Data Factory
12 37 (4.63%) PowerApps
13 36 (4.50%) Microsoft 365
14 32 (4.00%) Power Automate
15 30 (3.75%) Azure Synapse Analytics
16 29 (3.63%) Entra ID
17 27 (3.38%) Azure Functions
18 26 (3.25%) Azure Cosmos DB
18 26 (3.25%) Kontent
Communications & Networking
1 23 (2.88%) Network Security
2 22 (2.75%) Firewall
3 21 (2.63%) DNS
4 10 (1.25%) WAN
5 9 (1.13%) LAN
6 8 (1.00%) TCP/IP
7 4 (0.50%) VPN
7 4 (0.50%) WLAN
8 3 (0.38%) DHCP
8 3 (0.38%) Intranet
8 3 (0.38%) VoIP
8 3 (0.38%) Wireless
9 2 (0.25%) Extranet
9 2 (0.25%) Internet
10 1 (0.13%) NGFW
10 1 (0.13%) SD-WAN
10 1 (0.13%) VSAN
Database & Business Intelligence
1 192 (24.00%) SQL Server
2 70 (8.75%) Power BI
3 67 (8.38%) Azure SQL Database
4 43 (5.38%) Data Warehouse
5 25 (3.13%) Relational Database
6 24 (3.00%) Data Lake
7 19 (2.38%) NoSQL
8 18 (2.25%) PostgreSQL
9 16 (2.00%) MySQL
10 12 (1.50%) SQL Server Reporting Services
11 9 (1.13%) Microsoft Analysis Services
12 8 (1.00%) Delta Lake
12 8 (1.00%) DynamoDB
12 8 (1.00%) Elasticsearch
12 8 (1.00%) MongoDB
13 7 (0.88%) Big Data
13 7 (0.88%) SQL Server Integration Services
14 6 (0.75%) Data Mining
14 6 (0.75%) Metadata
14 6 (0.75%) RDBMS
Development Applications
1 153 (19.13%) Git
2 69 (8.63%) Visual Studio
3 55 (6.88%) JIRA
4 52 (6.50%) Team Foundation Server
5 46 (5.75%) Jenkins
6 35 (4.38%) Jasmine
7 28 (3.50%) Karma Test Runner
8 24 (3.00%) SonarQube
9 23 (2.88%) Selenium
10 20 (2.50%) TeamCity
11 18 (2.25%) Octopus Deploy
12 17 (2.13%) GitLab
13 15 (1.88%) MSBuild
13 15 (1.88%) Postman
14 13 (1.63%) NUnit
14 13 (1.63%) Visual Studio Code
15 10 (1.25%) Visual Studio Team System
16 9 (1.13%) SoapUI
17 8 (1.00%) SpecFlow
18 6 (0.75%) Cypress.io
General
1 156 (19.50%) Social Skills
2 155 (19.38%) Finance
3 67 (8.38%) Retail
4 46 (5.75%) Analytical Skills
5 22 (2.75%) Inclusion and Diversity
6 20 (2.50%) Law
6 20 (2.50%) Legal
7 19 (2.38%) Back Office
7 19 (2.38%) Marketing
8 16 (2.00%) Public Sector
9 14 (1.75%) Manufacturing
10 13 (1.63%) Organisational Skills
11 11 (1.38%) Police
12 9 (1.13%) Pharmaceutical
13 8 (1.00%) Automotive
14 7 (0.88%) Advertising
14 7 (0.88%) Games
15 6 (0.75%) Banking
16 5 (0.63%) Retail Finance
16 5 (0.63%) Tech for Good
Job Titles
1 337 (42.13%) Developer
2 202 (25.25%) Senior
3 126 (15.75%) C# Developer
4 124 (15.50%) .NET Developer
5 107 (13.38%) Senior Developer
6 97 (12.13%) Lead
7 92 (11.50%) Azure Engineer
8 87 (10.88%) DevOps Engineer
9 76 (9.50%) Software Developer
10 71 (8.88%) C# .NET Developer
11 65 (8.13%) Senior .NET Developer
12 55 (6.88%) Software Engineer
13 52 (6.50%) Architect
13 52 (6.50%) Azure DevOps Engineer
14 50 (6.25%) Senior C# Developer
15 49 (6.13%) Data Engineer
16 41 (5.13%) Cloud Engineer
16 41 (5.13%) Senior C# .NET Developer
17 39 (4.88%) Applications Developer
18 34 (4.25%) ASP.NET Developer
Libraries, Frameworks & Software Standards
1 362 (45.25%) .NET
2 147 (18.38%) .NET Framework
3 141 (17.63%) ASP.NET
4 130 (16.25%) React
5 128 (16.00%) AngularJS
6 107 (13.38%) .NET Core
7 96 (12.00%) HTML
8 90 (11.25%) CSS
9 81 (10.13%) REST
10 73 (9.13%) Web Services
11 72 (9.00%) ARM Templates
11 72 (9.00%) JSON
12 69 (8.63%) RESTful
13 62 (7.75%) Entity Framework
14 54 (6.75%) XML
15 52 (6.50%) ASP.NET MVC
16 42 (5.25%) YAML
17 41 (5.13%) SOAP
18 37 (4.63%) Sass
19 34 (4.25%) Next.js
Miscellaneous
1 44 (5.50%) Product Ownership
2 39 (4.88%) Cloud Native
3 30 (3.75%) Self-Motivation
4 27 (3.38%) Management Information System
5 24 (3.00%) Onboarding
6 21 (2.63%) Data Structures
6 21 (2.63%) Enterprise Software
6 21 (2.63%) Greenfield Project
7 16 (2.00%) FMCG
8 13 (1.63%) Mobile App
9 12 (1.50%) Public Cloud
10 10 (1.25%) Low-Code
11 9 (1.13%) Data Centre
11 9 (1.13%) Distributed Systems
12 8 (1.00%) NHS
12 8 (1.00%) Podcast
13 7 (0.88%) Client/Server
13 7 (0.88%) Housing Association
13 7 (0.88%) Virtual Team
14 6 (0.75%) Legacy Systems
Operating Systems
1 66 (8.25%) Windows
2 34 (4.25%) Linux
3 13 (1.63%) Windows Server
4 12 (1.50%) Android
5 8 (1.00%) Apple iOS
6 7 (0.88%) VMS
7 5 (0.63%) AIX
8 4 (0.50%) Red Hat Enterprise Linux
9 3 (0.38%) Unix
9 3 (0.38%) Windows Server 2019
10 1 (0.13%) Mac OS
10 1 (0.13%) Windows 10
Processes & Methodologies
1 800 (100.00%) DevOps
2 342 (42.75%) CI/CD
3 340 (42.50%) Agile
4 144 (18.00%) Software Engineering
5 126 (15.75%) Continuous Integration
6 125 (15.63%) Infrastructure as Code
7 115 (14.38%) Scrum
8 110 (13.75%) Problem-Solving
9 97 (12.13%) Test Automation
10 95 (11.88%) Mentoring
11 93 (11.63%) CRM
11 93 (11.63%) Microservices
12 87 (10.88%) Unit Testing
13 82 (10.25%) MVC
13 82 (10.25%) SDLC
14 81 (10.13%) Full Stack Development
15 67 (8.38%) Analytics
16 64 (8.00%) Project Delivery
17 62 (7.75%) Containerisation
18 61 (7.63%) Continuous Delivery
Programming Languages
1 378 (47.25%) C#
2 259 (32.38%) SQL
3 231 (28.88%) JavaScript
4 114 (14.25%) PowerShell
5 100 (12.50%) Python
6 89 (11.13%) TypeScript
7 56 (7.00%) Bicep
8 46 (5.75%) VB.NET
9 45 (5.63%) T-SQL
10 31 (3.88%) Java
11 28 (3.50%) VB
11 28 (3.50%) VB6
12 23 (2.88%) Bash
12 23 (2.88%) Data Analysis Expressions
13 19 (2.38%) Kusto Query Language
14 14 (1.75%) PHP
15 13 (1.63%) C++
16 11 (1.38%) C
16 11 (1.38%) Go
17 9 (1.13%) U-SQL
Qualifications
1 69 (8.63%) Degree
2 56 (7.00%) Azure Certification
3 47 (5.88%) Security Cleared
4 25 (3.13%) Microsoft Certification
5 24 (3.00%) SC Cleared
6 22 (2.75%) Computer Science Degree
7 18 (2.25%) BPSS Clearance
8 12 (1.50%) DBS Check
9 6 (0.75%) ISTQB
10 4 (0.50%) CCNA
10 4 (0.50%) Cisco Certification
10 4 (0.50%) CTC Cleared
11 3 (0.38%) CIPD
12 2 (0.25%) AWS Certification
12 2 (0.25%) CBAP
12 2 (0.25%) HNC
12 2 (0.25%) IIBA
12 2 (0.25%) ITIL Certification
12 2 (0.25%) Master's Degree
12 2 (0.25%) Numerate Degree
Quality Assurance & Compliance
1 90 (11.25%) QA
2 27 (3.38%) Accessibility
3 19 (2.38%) Data Quality
4 15 (1.88%) NCSC
5 10 (1.25%) GDPR
6 5 (0.63%) ISO/IEC 27001
7 4 (0.50%) EMIR
7 4 (0.50%) HIPAA
7 4 (0.50%) ISO 9001
7 4 (0.50%) MiFID
7 4 (0.50%) SOC 2
7 4 (0.50%) Solvency II
7 4 (0.50%) WCAG
8 3 (0.38%) SLA
9 2 (0.25%) PMO
10 1 (0.13%) PCI DSS
System Software
1 126 (15.75%) Docker
2 36 (4.50%) Virtual Machines
3 32 (4.00%) Active Directory
4 18 (2.25%) Virtual Desktop
5 3 (0.38%) Firmware
5 3 (0.38%) Hyper-V
5 3 (0.38%) VMware ESXi
5 3 (0.38%) VMware Infrastructure
6 2 (0.25%) Embedded Firmware
6 2 (0.25%) VMware Server
6 2 (0.25%) vSphere
Systems Management
1 160 (20.00%) Terraform
2 120 (15.00%) Kubernetes
3 39 (4.88%) Ansible
4 8 (1.00%) Docker Swarm
4 8 (1.00%) Grafana
4 8 (1.00%) MIIS
5 6 (0.75%) Microsoft Intune
5 6 (0.75%) Prometheus
6 4 (0.50%) HP Quality Center
7 3 (0.38%) Istio
8 2 (0.25%) Packer
8 2 (0.25%) Progress Chef
8 2 (0.25%) Rundeck
8 2 (0.25%) Salt
9 1 (0.13%) Consul
9 1 (0.13%) Galera Cluster
9 1 (0.13%) HAProxy
9 1 (0.13%) Kibana
9 1 (0.13%) Puppet
Vendors
1 335 (41.88%) Microsoft
2 54 (6.75%) Databricks
3 29 (3.63%) Sitecore
4 27 (3.38%) Optimizely
5 21 (2.63%) Oracle
6 13 (1.63%) Google
7 8 (1.00%) Informatica
8 7 (0.88%) VMware
9 6 (0.75%) Cisco
9 6 (0.75%) DevExpress
9 6 (0.75%) Meraki
9 6 (0.75%) ServiceNow
9 6 (0.75%) Twitter
9 6 (0.75%) Xamarin
10 5 (0.63%) Apple
11 4 (0.50%) BT
11 4 (0.50%) HP
11 4 (0.50%) Veracode
12 3 (0.38%) Splunk
12 3 (0.38%) Zscaler