T-SQL Jobs with Hybrid/Remote/WFH Options

Transact-SQL
UK > Work from Home

The table below provides summary statistics for permanent remote or hybrid work requiring T-SQL skills. It includes a benchmarking guide to the annual salaries offered in vacancies that cited T-SQL over the 6 months leading up to 3 July 2025, comparing them to the same period in the previous two years.

6 months to
3 Jul 2025
Same period 2024 Same period 2023
Rank 335 214 211
Rank change year-on-year -121 -3 -18
Permanent jobs citing T-SQL 141 551 586
As % of all permanent jobs with a WFH option 0.69% 1.60% 1.63%
As % of the Programming Languages category 1.99% 3.98% 3.44%
Number of salaries quoted 121 442 543
10th Percentile £41,250 £39,750 £41,250
25th Percentile £46,750 £47,500 £47,500
Median annual salary (50th Percentile) £55,000 £57,500 £57,500
Median % change year-on-year -4.35% - +9.52%
75th Percentile £69,375 £65,000 £67,500
90th Percentile £73,750 £72,500 £77,500
UK median annual salary £57,500 £55,000 £57,500
% change year-on-year +4.55% -4.35% +9.52%

All Programming Languages
Work from Home

T-SQL falls under the Programming Languages category. For comparison with the information above, the following table provides summary statistics for all permanent job vacancies with remote or hybrid options requiring coding skills.

Permanent vacancies with a requirement for coding skills 7,088 13,854 17,011
As % of all permanent jobs with a WFH option 34.78% 40.17% 47.30%
Number of salaries quoted 4,442 11,207 13,305
10th Percentile £38,750 £38,750 £40,588
25th Percentile £47,683 £46,250 £50,000
Median annual salary (50th Percentile) £62,500 £60,000 £65,000
Median % change year-on-year +4.17% -7.69% +4.00%
75th Percentile £83,750 £80,000 £85,000
90th Percentile £115,000 £105,000 £105,000
UK median annual salary £60,000 £60,000 £65,000
% change year-on-year - -7.69% +4.00%

T-SQL
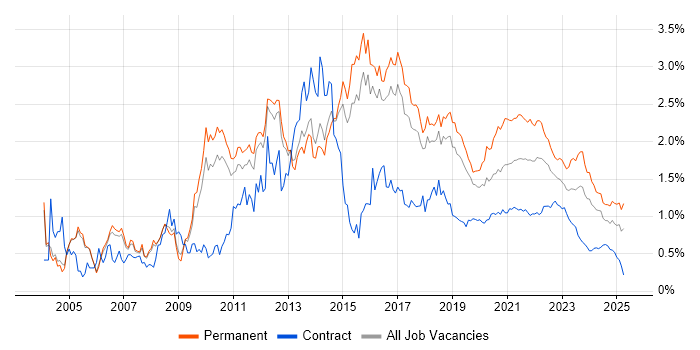
Trend for Jobs with a WFH Option

Job vacancies with remote working options citing T-SQL as a proportion of all IT jobs advertised.

T-SQL trend for jobs with Hybrid/Remote/WFH options

T-SQL
Salary Trend for Jobs with a WFH Option

3-month moving average salary quoted in job vacancies with remote working options citing T-SQL.

T-SQL salary trend for jobs with a WFH option

T-SQL
Salary Histogram for Jobs with a WFH Option

Salary distribution for jobs with remote working options citing T-SQL over the 6 months to 3 July 2025.

T-SQL salary histogram for jobs with a WFH option

T-SQL
Co-occurring Skills and Capabilities with WFH Options by Category

The follow tables expand on the table above by listing co-occurrences grouped by category. The same employment type, locality and period is covered with up to 20 co-occurrences shown in each of the following categories:

Application Platforms
1 13 (9.22%) Microsoft Exchange
2 9 (6.38%) SharePoint
3 3 (2.13%) Confluence
4 1 (0.71%) Apache
4 1 (0.71%) Apache Spark
4 1 (0.71%) CMS
4 1 (0.71%) EPiServer
4 1 (0.71%) Headless CMS
4 1 (0.71%) SharePoint 2013
4 1 (0.71%) Umbraco
Applications
1 10 (7.09%) Microsoft Excel
2 8 (5.67%) Microsoft Office
Business Applications
1 4 (2.84%) Sage 1000
1 4 (2.84%) Salesforce CRM
2 2 (1.42%) Dynamics AX
2 2 (1.42%) Dynamics CRM
Cloud Services
1 82 (58.16%) Azure
2 57 (40.43%) Power Platform
3 20 (14.18%) Azure Data Factory
4 19 (13.48%) SaaS
5 17 (12.06%) Microsoft 365
6 15 (10.64%) Azure Logic Apps
6 15 (10.64%) Power Automate
7 12 (8.51%) GitHub
8 11 (7.80%) Dynamics 365
8 11 (7.80%) PowerApps
9 10 (7.09%) AWS
10 9 (6.38%) Azure DevOps
11 7 (4.96%) Azure Monitor
12 5 (3.55%) Azure Stack
12 5 (3.55%) Azure Synapse Analytics
12 5 (3.55%) Snowflake
13 4 (2.84%) Fivetran
13 4 (2.84%) Google Analytics
13 4 (2.84%) Zapier
14 2 (1.42%) GCP
Communications & Networking
1 1 (0.71%) Remote Desktop
Database & Business Intelligence
1 87 (61.70%) SQL Server
2 51 (36.17%) SQL Server Integration Services
3 47 (33.33%) SQL Server Reporting Services
4 41 (29.08%) Power BI
5 22 (15.60%) Data Warehouse
6 19 (13.48%) Azure SQL Database
6 19 (13.48%) SQL Server Analysis Services
7 17 (12.06%) Relational Database
8 13 (9.22%) Data Hub
8 13 (9.22%) Metadata
8 13 (9.22%) SQL CLR
9 11 (7.80%) Data Lake
10 9 (6.38%) DB2
11 6 (4.26%) MySQL
12 5 (3.55%) NoSQL
13 4 (2.84%) Biml
13 4 (2.84%) Elasticsearch
13 4 (2.84%) RDBMS
13 4 (2.84%) Redis
14 3 (2.13%) Amazon RDS
Development Applications
1 20 (14.18%) Visual Studio
2 17 (12.06%) Git
3 8 (5.67%) JIRA
4 3 (2.13%) Bitbucket
5 1 (0.71%) Balsamiq
5 1 (0.71%) Eclipse
5 1 (0.71%) Grunt
5 1 (0.71%) gulp
5 1 (0.71%) Postman
5 1 (0.71%) SQL Server Management Studio (SSMS)
5 1 (0.71%) Subversion
5 1 (0.71%) Team Foundation Server
General
1 56 (39.72%) Finance
2 40 (28.37%) Social Skills
3 24 (17.02%) Analytical Skills
4 16 (11.35%) Law
5 13 (9.22%) Back Office
6 11 (7.80%) Manufacturing
7 10 (7.09%) Banking
7 10 (7.09%) Inclusion and Diversity
8 7 (4.96%) Billing
9 5 (3.55%) Legal
9 5 (3.55%) Social Housing
10 4 (2.84%) Advertising
10 4 (2.84%) Automotive
10 4 (2.84%) Swedish Language
11 3 (2.13%) Investment Banking
11 3 (2.13%) Organisational Skills
12 2 (1.42%) Retail
12 2 (1.42%) Tech for Good
13 1 (0.71%) Influencing Skills
13 1 (0.71%) Local Government
Job Titles
1 63 (44.68%) Developer
2 47 (33.33%) Senior
3 37 (26.24%) Analyst
4 26 (18.44%) SQL Developer
5 23 (16.31%) Senior Developer
6 22 (15.60%) Support Analyst
7 21 (14.89%) DBA
8 20 (14.18%) SQL DBA
9 15 (10.64%) Applications Support
9 15 (10.64%) Applications Support Analyst
9 15 (10.64%) Microsoft Developer
10 14 (9.93%) Senior Analyst
10 14 (9.93%) Senior SQL Developer
11 13 (9.22%) SaaS Developer
11 13 (9.22%) Senior Microsoft Developer
12 11 (7.80%) Administrator
12 11 (7.80%) SQL Analyst
13 10 (7.09%) Data Engineer
14 9 (6.38%) Systems Analyst
15 7 (4.96%) SQL Server DBA
Libraries, Frameworks & Software Standards
1 36 (25.53%) .NET
2 24 (17.02%) ASP.NET
3 23 (16.31%) .NET Framework
4 21 (14.89%) CSS
5 20 (14.18%) HTML
6 8 (5.67%) .NET Core
6 8 (5.67%) Web Services
7 7 (4.96%) React
8 6 (4.26%) ASP.NET Core
8 6 (4.26%) HTML5
9 4 (2.84%) CSS3
9 4 (2.84%) Elastic Stack
9 4 (2.84%) Entity Framework
9 4 (2.84%) HTML5 Canvas
9 4 (2.84%) LINQ
9 4 (2.84%) MassTransit
9 4 (2.84%) RabbitMQ
9 4 (2.84%) RESTful
10 3 (2.13%) AngularJS
10 3 (2.13%) ASP.NET MVC
Miscellaneous
1 13 (9.22%) Private Cloud
2 10 (7.09%) Data Structures
2 10 (7.09%) Management Information System
3 5 (3.55%) Data Centre
4 4 (2.84%) Driving Licence
4 4 (2.84%) Social Media
5 3 (2.13%) Cloud Native
5 3 (2.13%) Clustering
5 3 (2.13%) Product Ownership
5 3 (2.13%) Replication
5 3 (2.13%) Self-Motivation
5 3 (2.13%) Video Conferencing
6 2 (1.42%) Credit Risk
6 2 (1.42%) Legacy Systems
6 2 (1.42%) Reinsurance
7 1 (0.71%) Client/Server
7 1 (0.71%) Greenfield Project
7 1 (0.71%) Housing Association
7 1 (0.71%) Mobile App
7 1 (0.71%) NHS
Operating Systems
1 21 (14.89%) Windows
2 6 (4.26%) Linux
2 6 (4.26%) Unix
2 6 (4.26%) Windows Server
Processes & Methodologies
1 44 (31.21%) ETL
2 41 (29.08%) Business Intelligence
3 31 (21.99%) Performance Tuning
3 31 (21.99%) Problem-Solving
4 22 (15.60%) Fintech
5 21 (14.89%) Agile
5 21 (14.89%) Workflow
6 20 (14.18%) CI/CD
7 19 (13.48%) Analytics
8 17 (12.06%) Change Management
8 17 (12.06%) High Availability
8 17 (12.06%) Mentoring
9 16 (11.35%) Migration
9 16 (11.35%) Wealth Management
10 15 (10.64%) Disaster Recovery
10 15 (10.64%) Statistics
11 14 (9.93%) Infrastructure Engineering
11 14 (9.93%) Visualisation
12 13 (9.22%) Data Privacy
12 13 (9.22%) Refactoring
Programming Languages
1 134 (95.04%) SQL
2 39 (27.66%) C#
3 22 (15.60%) JavaScript
4 19 (13.48%) PowerShell
5 16 (11.35%) VB.NET
6 11 (7.80%) PL/SQL
7 7 (4.96%) Python
8 4 (2.84%) VBA
9 3 (2.13%) Java
9 3 (2.13%) PHP
10 2 (1.42%) Data Analysis Expressions
10 2 (1.42%) X++
11 1 (0.71%) TypeScript
11 1 (0.71%) VB
11 1 (0.71%) VBScript
Qualifications
1 18 (12.77%) Degree
2 4 (2.84%) DBS Check
2 4 (2.84%) Microsoft Certification
3 3 (2.13%) Computer Science Degree
4 2 (1.42%) Azure Certification
4 2 (1.42%) MCP
4 2 (1.42%) MCSE
5 1 (0.71%) ACCA
5 1 (0.71%) MCSD
Quality Assurance & Compliance
1 18 (12.77%) Data Quality
2 6 (4.26%) GDPR
3 4 (2.84%) Accessibility
3 4 (2.84%) Cyber Essentials
4 1 (0.71%) PCI DSS
4 1 (0.71%) QA
System Software
1 13 (9.22%) VMware Infrastructure
2 7 (4.96%) Docker
3 1 (0.71%) Active Directory
Systems Management
1 13 (9.22%) Failover Clustering
2 4 (2.84%) Kubernetes
3 2 (1.42%) Terraform
Vendors
1 63 (44.68%) Microsoft
2 13 (9.22%) VMware
3 9 (6.38%) Oracle
3 9 (6.38%) ServiceNow
4 8 (5.67%) Salesforce
5 7 (4.96%) Aderant
5 7 (4.96%) SolarWinds
6 5 (3.55%) Google
6 5 (3.55%) RedGate
7 4 (2.84%) Databricks
7 4 (2.84%) Sage
7 4 (2.84%) Xero
8 3 (2.13%) Informatica
8 3 (2.13%) SAP
8 3 (2.13%) Talend
9 2 (1.42%) JD Edwards
9 2 (1.42%) QAD
10 1 (0.71%) DocuSign
10 1 (0.71%) Telerik
10 1 (0.71%) Workday