DBS Check Jobs with Hybrid/Remote/WFH Options

Disclosure and Barring Service (DBS) Checks
UK > Work from Home

The table below provides summary statistics for remote or hybrid work with a requirement for DBS Check qualifications. It includes a benchmarking guide to the salaries offered over the 6 months leading up to 21 June 2025, comparing them to the same period in the previous two years.

6 months to
21 Jun 2025
Same period 2024 Same period 2023
Rank 187 160 341
Rank change year-on-year -27 +181 +177
Permanent jobs citing DBS Check 360 702 318
As % of all permanent jobs with a WFH option 1.83% 1.96% 0.87%
As % of the Qualifications category 4.86% 7.17% 3.28%
Number of salaries quoted 103 322 77
10th Percentile £28,288 £26,750 £35,000
25th Percentile £36,246 £35,000 £41,000
Median annual salary (50th Percentile) £46,315 £44,345 £53,219
Median % change year-on-year +4.44% -16.68% +18.26%
75th Percentile £53,750 £60,775 £65,000
90th Percentile £63,750 £64,980 £85,977
UK median annual salary £38,325 £37,917 £44,000
% change year-on-year +1.08% -13.83% +4.76%

All Academic and Professional Certifications
Work from Home

DBS Check falls under the Academic Qualifications and Professional Certifications category. For comparison with the information above, the following table provides summary statistics for all permanent job vacancies with remote or hybrid options requiring academic qualifications or professional certifications.

Permanent vacancies requiring academic qualifications or professional certifications 7,412 9,788 9,700
As % of all permanent jobs with a WFH option 37.66% 27.31% 26.43%
Number of salaries quoted 2,987 5,900 5,890
10th Percentile £30,000 £32,500 £35,000
25th Percentile £47,231 £42,500 £45,000
Median annual salary (50th Percentile) £57,500 £57,500 £60,000
Median % change year-on-year - -4.17% +2.37%
75th Percentile £70,600 £72,500 £77,715
90th Percentile £83,750 £86,250 £95,000
UK median annual salary £55,000 £52,977 £60,000
% change year-on-year +3.82% -11.71% +9.09%

DBS Check
Trend for Jobs with a WFH Option

Job vacancies with remote working options citing DBS Check as a proportion of all IT jobs advertised.
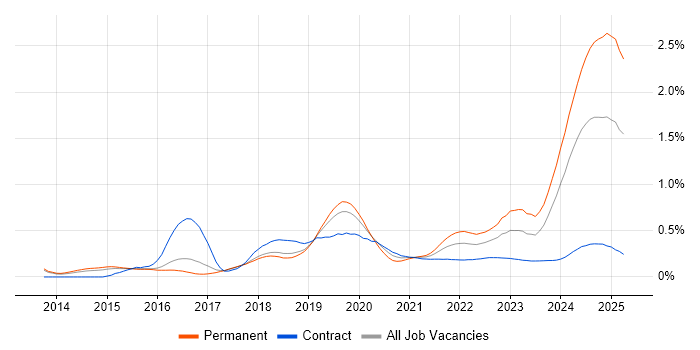
DBS Check trend for jobs with Hybrid/Remote/WFH options

DBS Check
Salary Trend for Jobs with a WFH Option

3-month moving average salary quoted in job vacancies with remote working options citing DBS Check.

DBS Check salary trend for jobs with a WFH option

DBS Check
Salary Histogram for Jobs with a WFH Option

Salary distribution for jobs with remote working options citing DBS Check over the 6 months to 21 June 2025.

DBS Check salary histogram for jobs with a WFH option

DBS Check
Co-occurring Skills and Capabilities with WFH Options by Category

The follow tables expand on the table above by listing co-occurrences grouped by category. The same employment type, locality and period is covered with up to 20 co-occurrences shown in each of the following categories:

Application Platforms
1 75 (20.83%) Oracle Application Server
2 13 (3.61%) SharePoint
3 7 (1.94%) Apache Spark
3 7 (1.94%) CMS
3 7 (1.94%) Microsoft Exchange
4 5 (1.39%) WordPress
5 4 (1.11%) SAS
6 3 (0.83%) Drupal
7 1 (0.28%) IIS
Applications
1 22 (6.11%) Microsoft Excel
2 21 (5.83%) Microsoft Office
3 11 (3.06%) Trello
4 8 (2.22%) Microsoft Project
4 8 (2.22%) MS Visio
4 8 (2.22%) Photoshop
5 7 (1.94%) Microsoft PowerPoint
6 5 (1.39%) Spreadsheet
7 1 (0.28%) Adobe After Effects
7 1 (0.28%) Adobe Premiere
Business Applications
1 12 (3.33%) Academy Revenues and Benefits
2 2 (0.56%) SAP BPC
2 2 (0.56%) SAP S/4HANA
2 2 (0.56%) Workday HCM
3 1 (0.28%) Dynamics CRM
3 1 (0.28%) Dynamics GP
3 1 (0.28%) Elite 3E
3 1 (0.28%) NetSuite
Cloud Services
1 63 (17.50%) Azure
2 44 (12.22%) Microsoft 365
3 43 (11.94%) SaaS
4 30 (8.33%) Power Platform
5 27 (7.50%) AWS
6 25 (6.94%) IaaS
6 25 (6.94%) PaaS
7 22 (6.11%) Entra ID
8 21 (5.83%) Power Automate
9 18 (5.00%) Azure DevOps
10 17 (4.72%) Azure Service Bus
11 16 (4.44%) Azure AI
11 16 (4.44%) Azure ExpressRoute
11 16 (4.44%) Azure Key Vault
11 16 (4.44%) Azure Monitor
12 14 (3.89%) Google Analytics
13 11 (3.06%) Serverless
14 9 (2.50%) Canva
14 9 (2.50%) Google Ads
15 8 (2.22%) Microsoft Advertising
Communications & Networking
1 31 (8.61%) DNS
2 22 (6.11%) Firewall
3 21 (5.83%) VPN
3 21 (5.83%) WAN
4 16 (4.44%) SD-WAN
5 12 (3.33%) WPA
6 7 (1.94%) DHCP
7 6 (1.67%) LAN
7 6 (1.67%) VoIP
8 4 (1.11%) Wireless
9 3 (0.83%) SAN
9 3 (0.83%) VLAN
10 2 (0.56%) Internet
10 2 (0.56%) Network Security
11 1 (0.28%) Cisco IOS
11 1 (0.28%) Converged Networks
11 1 (0.28%) F5 BIG-IP GTM
11 1 (0.28%) F5 BIG-IP LTM
11 1 (0.28%) NX-OS
11 1 (0.28%) WebEx
Database & Business Intelligence
1 79 (21.94%) Data Warehouse
2 75 (20.83%) Enterprise Data Warehouse
2 75 (20.83%) Oracle Reports
3 36 (10.00%) Tableau
4 29 (8.06%) Power BI
5 22 (6.11%) MySQL
6 18 (5.00%) Data Lake
7 12 (3.33%) SQL Server
8 9 (2.50%) PostgreSQL
9 6 (1.67%) GIS
10 4 (1.11%) Big Data
10 4 (1.11%) Relational Database
10 4 (1.11%) SQL Server Integration Services
11 3 (0.83%) Amazon Athena
11 3 (0.83%) MongoDB
11 3 (0.83%) Parquet
11 3 (0.83%) Power Query
11 3 (0.83%) RDBMS
11 3 (0.83%) Spark SQL
12 2 (0.56%) Looker
Development Applications
1 52 (14.44%) Git
2 8 (2.22%) JIRA
3 3 (0.83%) Bitbucket
3 3 (0.83%) GitLab
4 1 (0.28%) Android Studio
4 1 (0.28%) ERwin
4 1 (0.28%) ESLint
4 1 (0.28%) NUnit
4 1 (0.28%) Storybook
4 1 (0.28%) Visual Studio Code
4 1 (0.28%) webpack
General
1 232 (64.44%) Social Skills
2 149 (41.39%) Analytical Skills
3 148 (41.11%) Finance
4 86 (23.89%) Organisational Skills
5 77 (21.39%) Military
6 38 (10.56%) Marketing
7 36 (10.00%) Presentation Skills
8 33 (9.17%) Retail
9 28 (7.78%) Inclusion and Diversity
9 28 (7.78%) Local Government
10 19 (5.28%) Welsh Language
11 18 (5.00%) Legal
12 12 (3.33%) Advertising
13 11 (3.06%) Police
14 10 (2.78%) Public Sector
15 8 (2.22%) Pharmaceutical
16 6 (1.67%) Billing
16 6 (1.67%) Fire and Rescue
17 5 (1.39%) Automotive
17 5 (1.39%) Influencing Skills
Job Titles
1 53 (14.72%) Senior
2 40 (11.11%) Analyst
3 25 (6.94%) Database Engineer
4 22 (6.11%) Data Analyst
4 22 (6.11%) Developer
5 19 (5.28%) Lead
6 18 (5.00%) Architect
6 18 (5.00%) Business Manager
7 16 (4.44%) Business Development Manager
7 16 (4.44%) Cloud Architect
7 16 (4.44%) Development Manager
8 15 (4.17%) Project Manager
8 15 (4.17%) Senior Analyst
8 15 (4.17%) Team Leader
9 14 (3.89%) Product Manager
10 13 (3.61%) Delivery Manager
10 13 (3.61%) Senior Data Analyst
10 13 (3.61%) Senior Developer
11 11 (3.06%) Product Delivery Manager
12 10 (2.78%) IT Engineer
Libraries, Frameworks & Software Standards
1 14 (3.89%) .NET
2 12 (3.33%) PySpark
3 11 (3.06%) React Native
4 10 (2.78%) Blazor
4 10 (2.78%) Flutter
5 9 (2.50%) EDI
5 9 (2.50%) Pandas
5 9 (2.50%) scikit-learn
5 9 (2.50%) TensorFlow
6 8 (2.22%) HTML
7 6 (1.67%) REST
8 5 (1.39%) Bootstrap
8 5 (1.39%) HTML5
9 4 (1.11%) Dask
9 4 (1.11%) Polars
10 3 (0.83%) CSS
10 3 (0.83%) JSON
10 3 (0.83%) XGBoost
11 2 (0.56%) SAP Fiori
11 2 (0.56%) SOAP
Miscellaneous
1 53 (14.72%) Social Media
2 19 (5.28%) NHS
3 17 (4.72%) Data Centre
3 17 (4.72%) Self-Motivation
4 16 (4.44%) Management Information System
4 16 (4.44%) Onboarding
5 10 (2.78%) Credit Risk
6 9 (2.50%) Algorithms
6 9 (2.50%) Driving Licence
7 8 (2.22%) IoT
8 7 (1.94%) Biopharmaceutical
9 6 (1.67%) Public Cloud
10 4 (1.11%) Product Ownership
10 4 (1.11%) Virtual Team
11 3 (0.83%) Educational Technology
11 3 (0.83%) e-Learning
11 3 (0.83%) Enterprise Software
12 2 (0.56%) Clustering
12 2 (0.56%) Graphic Design
12 2 (0.56%) Smart Energy
Operating Systems
1 51 (14.17%) Windows
2 25 (6.94%) Windows Vista
3 17 (4.72%) Windows Server
4 4 (1.11%) Android
4 4 (1.11%) Linux
4 4 (1.11%) Windows Server 2016
4 4 (1.11%) Windows Server 2019
5 3 (0.83%) Mac OS
5 3 (0.83%) Windows 10
6 1 (0.28%) Apple iOS
Processes & Methodologies
1 150 (41.67%) Analytics
2 148 (41.11%) Agile
3 114 (31.67%) ITIL
4 109 (30.28%) DevOps
5 103 (28.61%) Service Management
6 97 (26.94%) Customer Experience
7 93 (25.83%) Data Integration
8 85 (23.61%) Data Modelling
9 83 (23.06%) Data Management
10 76 (21.11%) Business Analysis
11 70 (19.44%) Problem-Solving
12 54 (15.00%) Continuous Improvement
13 45 (12.50%) Project Management
14 44 (12.22%) Roadmaps
15 41 (11.39%) Artificial Intelligence
16 40 (11.11%) Visualisation
17 37 (10.28%) Storytelling
18 33 (9.17%) Stakeholder Management
18 33 (9.17%) Statistics
19 32 (8.89%) Collaborative Working
Programming Languages
1 79 (21.94%) SQL
2 51 (14.17%) Python
3 22 (6.11%) PowerShell
4 16 (4.44%) Bicep
5 5 (1.39%) VB
5 5 (1.39%) VBA
6 4 (1.11%) R
6 4 (1.11%) T-SQL
7 3 (0.83%) C#
7 3 (0.83%) Data Analysis Expressions
8 2 (0.56%) VB.NET
9 1 (0.28%) Apex Code
9 1 (0.28%) C
9 1 (0.28%) C++
9 1 (0.28%) Dart
9 1 (0.28%) Java
9 1 (0.28%) JavaScript
9 1 (0.28%) TypeScript
Qualifications
1 77 (21.39%) Degree
2 26 (7.22%) Azure Certification
3 19 (5.28%) Master's Degree
4 15 (4.17%) Microsoft Certification
5 11 (3.06%) MCSA
6 9 (2.50%) MOS
7 8 (2.22%) MCSE
7 8 (2.22%) PMI Certification
7 8 (2.22%) PMP
8 7 (1.94%) Security Cleared
9 6 (1.67%) HNC
9 6 (1.67%) HND
10 5 (1.39%) SC Cleared
11 4 (1.11%) BPSS Clearance
11 4 (1.11%) MRICS
12 3 (0.83%) A+ Certification
12 3 (0.83%) MCP
13 2 (0.56%) Computer Science Degree
14 1 (0.28%) Cisco Certification
14 1 (0.28%) PhD
Quality Assurance & Compliance
1 19 (5.28%) SLA
2 11 (3.06%) QA
3 6 (1.67%) Data Quality
4 5 (1.39%) GDPR
5 4 (1.11%) Accessibility
6 2 (0.56%) ISO/IEC 27001
7 1 (0.28%) Cyber Essentials
7 1 (0.28%) Disclosure Scotland
7 1 (0.28%) GRC
7 1 (0.28%) NIST
7 1 (0.28%) PCI DSS
System Software
1 23 (6.39%) Active Directory
2 17 (4.72%) Virtual Machines
3 8 (2.22%) Virtual Desktop
3 8 (2.22%) VMware Infrastructure
4 4 (1.11%) Hyper-V
5 2 (0.56%) Docker
5 2 (0.56%) IAG
6 1 (0.28%) Firmware
6 1 (0.28%) Forefront TMG
6 1 (0.28%) ISA Server
6 1 (0.28%) Virtual Servers
Systems Management
1 18 (5.00%) Single Sign-On
2 14 (3.89%) Microsoft Intune
3 6 (1.67%) Jamf Pro
3 6 (1.67%) SmoothWall
4 1 (0.28%) Ansible
4 1 (0.28%) EMC NetWorker
4 1 (0.28%) FortiGate
4 1 (0.28%) Grafana
4 1 (0.28%) Terraform
Vendors
1 85 (23.61%) Microsoft
2 75 (20.83%) Oracle
3 55 (15.28%) Databricks
4 22 (6.11%) Meraki
5 19 (5.28%) Google
6 12 (3.33%) Cisco
7 9 (2.50%) NEC
8 8 (2.22%) VMware
9 7 (1.94%) Salesforce
10 6 (1.67%) SAP
11 5 (1.39%) Adobe
11 5 (1.39%) Logitech
12 4 (1.11%) Palo Alto
12 4 (1.11%) SonicWALL
12 4 (1.11%) YouTube
13 3 (0.83%) Apple
13 3 (0.83%) EMC
13 3 (0.83%) Informatica
13 3 (0.83%) RedGate
13 3 (0.83%) Talend