Visualisation Jobs with Work from Home Options

Visualization
UK > Work from Home

The table below provides summary statistics for permanent remote or hybrid work requiring Visualisation skills. It includes a benchmarking guide to the annual salaries offered in vacancies that cited Visualisation over the 6 months leading up to 26 July 2024, comparing them to the same period in the previous two years.

6 months to
26 Jul 2024
Same period 2023 Same period 2022
Rank 99 129 125
Rank change year-on-year +30 -4 +2
Permanent jobs citing Visualisation 808 845 2,539
As % of all permanent jobs with a WFH option 2.89% 2.57% 3.23%
As % of the Processes & Methodologies category 3.27% 2.69% 3.33%
Number of salaries quoted 431 662 1,006
10th Percentile £41,250 £39,294 £37,500
25th Percentile £43,375 £46,250 £45,000
Median annual salary (50th Percentile) £60,000 £60,125 £60,000
Median % change year-on-year -0.21% +0.21% +14.29%
75th Percentile £77,250 £77,530 £77,500
90th Percentile £85,000 £91,125 £92,500
UK median annual salary £60,000 £60,000 £60,000
% change year-on-year - - +9.09%

All Process and Methodology Skills
Work from Home

Visualisation falls under the Processes and Methodologies category. For comparison with the information above, the following table provides summary statistics for all permanent job vacancies with remote or hybrid options requiring process or methodology skills.

Permanent vacancies with a requirement for process or methodology skills 24,720 31,469 76,283
As % of all permanent jobs with a WFH option 88.48% 95.89% 97.14%
Number of salaries quoted 17,624 23,346 43,834
10th Percentile £35,000 £37,500 £36,250
25th Percentile £42,500 £47,500 £46,250
Median annual salary (50th Percentile) £57,965 £62,500 £60,000
Median % change year-on-year -7.26% +4.17% +9.09%
75th Percentile £77,500 £81,250 £80,000
90th Percentile £96,250 £100,000 £95,000
UK median annual salary £55,000 £60,000 £60,000
% change year-on-year -8.33% - +9.09%

Visualisation
Trend for Jobs with a WFH Option

Job vacancies with a work from home option citing Visualisation as a proportion of all IT jobs advertised.
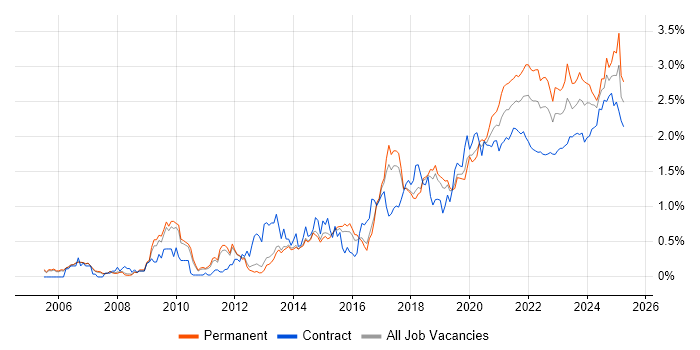
Visualisation trend for jobs with a WFH option

Visualisation
Salary Trend for Jobs with a WFH Option

3-month moving average salary quoted in job vacancies with a work from home option citing Visualisation.

Visualisation salary trend for jobs with a WFH option

Visualisation
Salary Histogram for Jobs with a WFH Option

Salary distribution for jobs with a work from home option citing Visualisation over the 6 months to 26 July 2024.

Visualisation salary histogram for jobs with a WFH option

Visualisation
Co-occurring Skills and Capabilities with WFH Options by Category

The follow tables expand on the table above by listing co-occurrences grouped by category. The same employment type, locality and period is covered with up to 20 co-occurrences shown in each of the following categories:

Application Platforms
1 12 (1.49%) Apache Airflow
1 12 (1.49%) Apache Spark
2 10 (1.24%) Confluence
2 10 (1.24%) SAS
2 10 (1.24%) SharePoint
3 8 (0.99%) Apache
4 4 (0.50%) ArcGIS
4 4 (0.50%) nginx
5 1 (0.12%) CMS
5 1 (0.12%) IIS
Applications
1 55 (6.81%) Microsoft Excel
2 12 (1.49%) Microsoft Office
3 8 (0.99%) Spreadsheet
4 3 (0.37%) Microsoft PowerPoint
5 2 (0.25%) Adobe Creative Suite
5 2 (0.25%) InDesign
5 2 (0.25%) Photoshop
5 2 (0.25%) Sketch
5 2 (0.25%) SPSS
5 2 (0.25%) Stata
6 1 (0.12%) Adobe Illustrator
6 1 (0.12%) Adobe XD
6 1 (0.12%) Chatbot
6 1 (0.12%) InVision
6 1 (0.12%) MS Visio
6 1 (0.12%) Simulink
6 1 (0.12%) Zeplin
Business Applications
1 15 (1.86%) Dynamics CRM
2 8 (0.99%) Elite 3E
3 3 (0.37%) NetSuite
3 3 (0.37%) SAP S/4HANA
4 2 (0.25%) MIS ActiveH
4 2 (0.25%) NEC Housing
4 2 (0.25%) Salesforce CRM
5 1 (0.12%) Data Workbench
5 1 (0.12%) Endur
5 1 (0.12%) SAP ERP
5 1 (0.12%) Visualfiles
5 1 (0.12%) Workday HCM
Cloud Services
1 257 (31.81%) Power Platform
2 196 (24.26%) AWS
3 174 (21.53%) Azure
4 72 (8.91%) Azure Synapse Analytics
5 69 (8.54%) Azure Data Factory
6 34 (4.21%) GCP
7 29 (3.59%) Azure DevOps
8 28 (3.47%) dbt
9 24 (2.97%) Snowflake
10 23 (2.85%) PowerApps
11 19 (2.35%) Power Automate
12 18 (2.23%) Serverless
13 16 (1.98%) Dynamics 365
14 11 (1.36%) Azure Data Lake Analytics
14 11 (1.36%) GitHub
15 10 (1.24%) Cloud Composer
15 10 (1.24%) SaaS
16 9 (1.11%) AWS Lambda
17 8 (0.99%) Microsoft 365
18 6 (0.74%) WhatsApp
Communications & Networking
1 36 (4.46%) Network Security
2 10 (1.24%) Firewall
3 3 (0.37%) OpenVPN
4 1 (0.12%) Broadband
4 1 (0.12%) HTTP
4 1 (0.12%) Internet
4 1 (0.12%) LAN
4 1 (0.12%) Radio Access Network
4 1 (0.12%) WAN
Database & Business Intelligence
1 297 (36.76%) Tableau
2 257 (31.81%) Power BI
3 117 (14.48%) Data Warehouse
4 66 (8.17%) SQL Server
5 56 (6.93%) Data Lake
6 46 (5.69%) BigQuery
7 34 (4.21%) SQL Server Integration Services
8 30 (3.71%) SQL Server Reporting Services
9 25 (3.09%) QlikView
10 24 (2.97%) Looker
11 23 (2.85%) Power Query
12 22 (2.72%) Relational Database
13 18 (2.23%) SQL Server Analysis Services
14 16 (1.98%) Azure SQL Database
14 16 (1.98%) NoSQL
15 15 (1.86%) Enterprise Data Warehouse
16 13 (1.61%) Big Data
16 13 (1.61%) Microsoft Analysis Services
17 11 (1.36%) Hadoop
17 11 (1.36%) Semantic Layer
Development Applications
1 189 (23.39%) Git
2 19 (2.35%) JIRA
3 15 (1.86%) GitLab
3 15 (1.86%) SQL Server Management Studio (SSMS)
4 10 (1.24%) Jenkins
5 8 (0.99%) Burp Suite
5 8 (0.99%) Metasploit
5 8 (0.99%) Visual Studio
6 4 (0.50%) Postman
7 3 (0.37%) Android Studio
7 3 (0.37%) Bitbucket
8 2 (0.25%) CircleCI
9 1 (0.12%) Spinnaker
9 1 (0.12%) Vite
General
1 407 (50.37%) Social Skills
2 316 (39.11%) Analytical Skills
3 181 (22.40%) Retail
4 157 (19.43%) Presentation Skills
5 125 (15.47%) Finance
6 64 (7.92%) Legal
7 54 (6.68%) Pharmaceutical
8 38 (4.70%) Marketing
9 33 (4.08%) Inclusion and Diversity
10 26 (3.22%) Public Sector
11 17 (2.10%) Local Government
12 13 (1.61%) Law
13 12 (1.49%) Banking
14 8 (0.99%) Manufacturing
15 7 (0.87%) Games
16 6 (0.74%) Electronics
17 5 (0.62%) Influencing Skills
17 5 (0.62%) Military
18 4 (0.50%) Multimedia
18 4 (0.50%) Publishing
Job Titles
1 328 (40.59%) Analyst
2 265 (32.80%) Senior
3 191 (23.64%) Data Analyst
4 134 (16.58%) Senior Analyst
5 112 (13.86%) Senior Data Analyst
6 89 (11.01%) Developer
7 86 (10.64%) Data Engineer
8 75 (9.28%) Data Scientist
9 71 (8.79%) Lead
10 70 (8.66%) Senior Data Scientist
11 36 (4.46%) Software Engineer
12 34 (4.21%) Power BI Developer
13 33 (4.08%) Business Intelligence Developer
13 33 (4.08%) Lead Data Analyst
14 31 (3.84%) Consultant
15 30 (3.71%) Data Manager
15 30 (3.71%) Digital Analyst
15 30 (3.71%) Performance Analyst
16 28 (3.47%) Digital Performance Analyst
17 24 (2.97%) Business Intelligence Analyst
Libraries, Frameworks & Software Standards
1 53 (6.56%) Pandas
2 52 (6.44%) PySpark
3 47 (5.82%) scikit-learn
4 46 (5.69%) TensorFlow
5 32 (3.96%) CSS
6 30 (3.71%) React
7 26 (3.22%) HTML
8 21 (2.60%) Node.js
9 16 (1.98%) REST
10 14 (1.73%) Web Services
11 11 (1.36%) .NET
12 9 (1.11%) Redux
12 9 (1.11%) WebGL
13 8 (0.99%) XML
14 7 (0.87%) D3.js
14 7 (0.87%) JSON
15 6 (0.74%) GraphQL
15 6 (0.74%) HTML5
15 6 (0.74%) NumPy
15 6 (0.74%) Vue
Miscellaneous
1 135 (16.71%) Algorithms
2 49 (6.06%) Life Science
3 46 (5.69%) Data Structures
4 20 (2.48%) Cloud Native
5 19 (2.35%) NHS
6 14 (1.73%) Mobile App
7 13 (1.61%) Analytical Mindset
7 13 (1.61%) Onboarding
8 12 (1.49%) Distributed Systems
8 12 (1.49%) Enterprise Software
9 11 (1.36%) Product Ownership
10 10 (1.24%) Legacy Systems
11 8 (0.99%) Blog
11 8 (0.99%) Driving Licence
11 8 (0.99%) Management Information System
12 7 (0.87%) Augmented Reality
12 7 (0.87%) Mainframe
12 7 (0.87%) Virtual Reality
13 6 (0.74%) IoT
13 6 (0.74%) Self-Motivation
Operating Systems
1 15 (1.86%) Linux
2 9 (1.11%) Windows
3 8 (0.99%) Windows Server
4 3 (0.37%) Android
4 3 (0.37%) CentOS
5 1 (0.12%) Solaris
5 1 (0.12%) Unix
5 1 (0.12%) VMS
5 1 (0.12%) Windows 10
5 1 (0.12%) Windows Server 2019
Processes & Methodologies
1 474 (58.66%) Analytics
2 403 (49.88%) Data Visualisation
3 299 (37.00%) Data Analysis
4 274 (33.91%) Problem-Solving
5 270 (33.42%) Statistics
6 260 (32.18%) Actionable Insight
7 253 (31.31%) Business Intelligence
8 207 (25.62%) Mathematics
9 206 (25.50%) Storytelling
10 197 (24.38%) Decision-Making
11 195 (24.13%) Data Pipeline
12 180 (22.28%) Data Science
13 172 (21.29%) Root Cause Analysis
14 167 (20.67%) Agile
15 156 (19.31%) Data Modelling
16 136 (16.83%) ETL
17 132 (16.34%) Business Strategy
18 130 (16.09%) Stakeholder Engagement
19 127 (15.72%) Customer Intelligence
20 121 (14.98%) Software Engineering
Programming Languages
1 485 (60.02%) SQL
2 352 (43.56%) Python
3 54 (6.68%) JavaScript
4 44 (5.45%) Data Analysis Expressions
5 36 (4.46%) T-SQL
6 35 (4.33%) R
7 31 (3.84%) C#
8 21 (2.60%) Java
9 14 (1.73%) TypeScript
9 14 (1.73%) VBA
10 11 (1.36%) U-SQL
11 10 (1.24%) PowerShell
12 9 (1.11%) C
12 9 (1.11%) Shell Script
13 8 (0.99%) Go
14 6 (0.74%) C++
14 6 (0.74%) Kusto Query Language
15 5 (0.62%) Perl
15 5 (0.62%) PL/SQL
15 5 (0.62%) Scala
Qualifications
1 361 (44.68%) Degree
2 202 (25.00%) DBS Check
3 122 (15.10%) Master's Degree
4 53 (6.56%) PhD
5 39 (4.83%) Computer Science Degree
5 39 (4.83%) Security Cleared
6 24 (2.97%) SC Cleared
7 16 (1.98%) Microsoft Certification
8 13 (1.61%) BPSS Clearance
9 11 (1.36%) Numerate Degree
10 7 (0.87%) MBA
11 6 (0.74%) Azure Certification
11 6 (0.74%) PMI Certification
12 4 (0.50%) MCP
13 3 (0.37%) DV Cleared
13 3 (0.37%) ISTQB
14 2 (0.25%) PMP
15 1 (0.12%) CISA
15 1 (0.12%) CISM
15 1 (0.12%) CRISC
Quality Assurance & Compliance
1 55 (6.81%) Data Quality
2 28 (3.47%) QA
3 14 (1.73%) GDPR
4 11 (1.36%) Accessibility
5 8 (0.99%) California Consumer Privacy Act
6 3 (0.37%) Actionable Recommendations
7 2 (0.25%) GLP
7 2 (0.25%) HIPAA
8 1 (0.12%) NIST
System Software
1 18 (2.23%) Docker
2 7 (0.87%) Active Directory
3 3 (0.37%) Virtual Machines
3 3 (0.37%) vSphere
4 2 (0.25%) Virtual Servers
5 1 (0.12%) Hyper-V
5 1 (0.12%) Microsoft Virtual Server
5 1 (0.12%) VMware ESXi
Systems Management
1 18 (2.23%) Terraform
2 11 (1.36%) Kubernetes
3 8 (0.99%) Ansible
3 8 (0.99%) Nmap
4 4 (0.50%) Grafana
4 4 (0.50%) Kibana
5 2 (0.25%) Progress Chef
5 2 (0.25%) Puppet
6 1 (0.12%) FTK
6 1 (0.12%) Packer
6 1 (0.12%) SCCM
Vendors
1 234 (28.96%) Databricks
2 128 (15.84%) Microsoft
3 27 (3.34%) Google
4 16 (1.98%) SAP
5 13 (1.61%) Salesforce
6 12 (1.49%) Facebook
6 12 (1.49%) Oracle
7 11 (1.36%) Splunk
8 8 (0.99%) Alteryx
9 7 (0.87%) Teradata
10 5 (0.62%) Mapbox
11 4 (0.50%) Aderant
11 4 (0.50%) Adobe
11 4 (0.50%) ServiceNow
11 4 (0.50%) Workday
12 3 (0.37%) ESRI
12 3 (0.37%) Informatica
13 2 (0.25%) Ab Initio
13 2 (0.25%) Charles River
13 2 (0.25%) NEC