Senior Analyst Jobs with Hybrid/Remote/WFH Options

Senior Analyst
UK > Work from Home

The median Senior Analyst salary for remote or hybrid work is £65,000 per year, according to job vacancies posted during the 6 months leading to 1 May 2025.

The table below provides salary benchmarking and summary statistics, comparing them to the same period in the previous two years.

6 months to
1 May 2025
Same period 2024 Same period 2023
Rank 212 166 111
Rank change year-on-year -46 -55 +181
Permanent jobs requiring a Senior Analyst 205 666 1,259
As % of all permanent jobs with a WFH option 1.37% 1.97% 2.94%
As % of the Job Titles category 1.51% 2.05% 3.06%
Number of salaries quoted 138 283 396
10th Percentile £38,750 £40,000 £38,558
25th Percentile £51,250 £46,250 £46,250
Median annual salary (50th Percentile) £65,000 £55,000 £55,000
Median % change year-on-year +18.18% - -4.35%
75th Percentile £71,250 £75,000 £70,000
90th Percentile £83,250 £82,500 £81,875
UK median annual salary £60,000 £57,500 £55,000
% change year-on-year +4.35% +4.55% -

All Permanent IT Job Vacancies
Work from Home

For comparison with the information above, the following table provides summary statistics for all permanent IT job vacancies with WFH or hybrid options. Most job vacancies include a discernible job title that can be normalized. As such, the figures in the second row provide an indication of the number of permanent jobs in our overall sample.

Permanent vacancies in Work from Home with a recognized job title 13,554 32,482 41,080
% of permanent jobs with a recognized job title 90.64% 95.99% 96.08%
Number of salaries quoted 9,860 24,960 29,208
10th Percentile £30,000 £33,000 £36,500
25th Percentile £43,750 £42,500 £47,250
Median annual salary (50th Percentile) £60,000 £56,000 £62,500
Median % change year-on-year +7.14% -10.40% +4.17%
75th Percentile £77,500 £75,000 £81,250
90th Percentile £100,000 £92,500 £100,000
UK median annual salary £57,500 £52,777 £60,000
% change year-on-year +8.95% -12.04% -

Senior Analyst
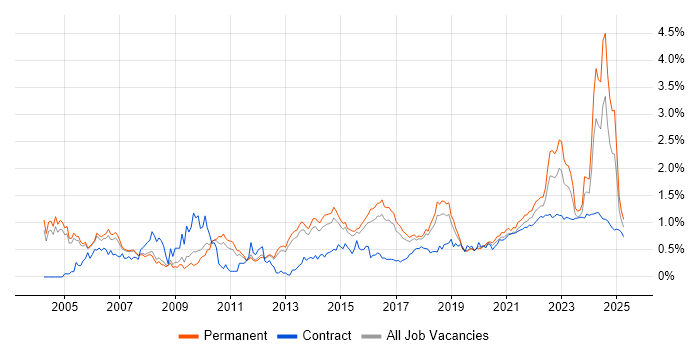
Trend for Jobs with a WFH Option

Job vacancies with remote working options which featured Senior Analyst in the job title as a proportion of all IT jobs advertised.

Senior Analyst trend for jobs with Hybrid/Remote/WFH options

Senior Analyst
Salary Trend for Jobs with a WFH Option

3-month moving average salary quoted in job vacancies with remote working options citing Senior Analyst.

Senior Analyst salary trend for jobs with a WFH option

Senior Analyst
Salary Histogram for Jobs with a WFH Option

Salary distribution for jobs with remote working options citing Senior Analyst over the 6 months to 1 May 2025.

Senior Analyst salary histogram for jobs with a WFH option

Senior Analyst Skill Set
Top 30 Co-occurring Skills and Capabilities in Job Vacancies with WFH Options

For the 6 months to 1 May 2025, Senior Analyst job roles required the following skills and capabilities in order of popularity. The figures indicate the absolute number co-occurrences and as a proportion of all permanent jobs with hybrid or remote work options featuring Senior Analyst in the job title.

1 113 (55.12%) Social Skills
2 109 (53.17%) SQL
3 99 (48.29%) Finance
4 79 (38.54%) Analytical Skills
5 72 (35.12%) Analytics
6 65 (31.71%) Python
7 62 (30.24%) Problem-Solving
8 58 (28.29%) Visualisation
9 48 (23.41%) Degree
9 48 (23.41%) Tableau
10 46 (22.44%) Azure
11 44 (21.46%) Microsoft
12 43 (20.98%) Retail
13 39 (19.02%) Power Platform
14 38 (18.54%) Agile
15 36 (17.56%) Business Intelligence
16 33 (16.10%) DBS Check
16 33 (16.10%) Power BI
16 33 (16.10%) Mentoring
17 31 (15.12%) Data Visualisation
18 29 (14.15%) Windows
18 29 (14.15%) Data Analysis
19 28 (13.66%) SQL Server Reporting Services
19 28 (13.66%) SQL Server
19 28 (13.66%) Databricks
19 28 (13.66%) Storytelling
20 27 (13.17%) Data Pipeline
21 26 (12.68%) Git
21 26 (12.68%) Root Cause Analysis
21 26 (12.68%) .NET

Senior Analyst Skill Set
Co-occurring Skills and Capabilities with WFH Options by Category

The follow tables expand on the table above by listing co-occurrences grouped by category. The same employment type, locality and period is covered with up to 20 co-occurrences shown in each of the following categories:

Application Platforms
1 10 (4.88%) SharePoint
2 5 (2.44%) Confluence
2 5 (2.44%) SAS
3 4 (1.95%) Microsoft Exchange
4 3 (1.46%) Apache Spark
5 1 (0.49%) Jupyter
Applications
1 19 (9.27%) Microsoft Excel
2 4 (1.95%) Microsoft Office
3 2 (0.98%) MS Visio
4 1 (0.49%) SPSS
Business Applications
1 2 (0.98%) Dynamics AX
2 1 (0.49%) ION Anvil
2 1 (0.49%) ION MarketView
2 1 (0.49%) NetSuite
2 1 (0.49%) Oracle EBS
2 1 (0.49%) Oracle EBS R12
2 1 (0.49%) Oracle ERP
2 1 (0.49%) Oracle SCM
2 1 (0.49%) SAP ERP
Cloud Services
1 46 (22.44%) Azure
2 39 (19.02%) Power Platform
3 22 (10.73%) Microsoft 365
4 7 (3.41%) Azure Data Factory
4 7 (3.41%) Dynamics 365
5 6 (2.93%) AWS
5 6 (2.93%) Azure Logic Apps
5 6 (2.93%) Azure Monitor
6 5 (2.44%) SaaS
7 3 (1.46%) GCP
7 3 (1.46%) GitHub
7 3 (1.46%) Google Workspace
7 3 (1.46%) PowerApps
8 2 (0.98%) Entra ID
9 1 (0.49%) Azure Machine Learning
9 1 (0.49%) Azure Synapse Analytics
9 1 (0.49%) dbt
9 1 (0.49%) Google Tag Manager
9 1 (0.49%) Intacct
9 1 (0.49%) Miro
Communications & Networking
1 4 (1.95%) Firewall
2 2 (0.98%) DHCP
2 2 (0.98%) DNS
3 1 (0.49%) Intranet
3 1 (0.49%) Network Security
3 1 (0.49%) Remote Desktop
3 1 (0.49%) TCP/IP
3 1 (0.49%) VLAN
3 1 (0.49%) VoIP
3 1 (0.49%) WAN
3 1 (0.49%) Wireless
Database & Business Intelligence
1 48 (23.41%) Tableau
2 33 (16.10%) Power BI
3 28 (13.66%) SQL Server
3 28 (13.66%) SQL Server Reporting Services
4 26 (12.68%) SQL Server Integration Services
5 25 (12.20%) DB2
6 9 (4.39%) Relational Database
7 8 (3.90%) Looker
8 6 (2.93%) Data Warehouse
9 4 (1.95%) Oracle Reports
10 3 (1.46%) Data Mining
10 3 (1.46%) Hadoop
10 3 (1.46%) Oracle BI Publisher
11 2 (0.98%) Big Data
11 2 (0.98%) BusinessObjects
11 2 (0.98%) Oracle Database
12 1 (0.49%) Amazon QuickSight
12 1 (0.49%) Mixpanel
12 1 (0.49%) Power Query
12 1 (0.49%) RDBMS
Development Applications
1 26 (12.68%) Git
2 9 (4.39%) Visual Studio
3 4 (1.95%) JIRA
4 2 (0.98%) Selenium
5 1 (0.49%) Cypress.io
5 1 (0.49%) Oracle APEX
5 1 (0.49%) Oracle Forms
General
1 113 (55.12%) Social Skills
2 99 (48.29%) Finance
3 79 (38.54%) Analytical Skills
4 43 (20.98%) Retail
5 24 (11.71%) Presentation Skills
6 22 (10.73%) Banking
6 22 (10.73%) Billing
7 21 (10.24%) Marketing
8 16 (7.80%) Legal
9 14 (6.83%) Influencing Skills
10 12 (5.85%) Law
11 11 (5.37%) Organisational Skills
12 4 (1.95%) Advertising
12 4 (1.95%) Back Office
12 4 (1.95%) Inclusion and Diversity
13 3 (1.46%) Automotive
13 3 (1.46%) Documentation Skills
13 3 (1.46%) Manufacturing
13 3 (1.46%) Prime Brokerage
14 2 (0.98%) Dutch Language
Libraries, Frameworks & Software Standards
1 26 (12.68%) .NET
2 8 (3.90%) .NET Framework
2 8 (3.90%) ASP.NET
3 5 (2.44%) XML
4 4 (1.95%) HTML
4 4 (1.95%) JSON
4 4 (1.95%) Lightning Web Components
5 3 (1.46%) Oracle Fusion
6 2 (0.98%) PySpark
7 1 (0.49%) .NET Core
Miscellaneous
1 17 (8.29%) Legacy Applications
2 15 (7.32%) Management Information System
3 8 (3.90%) Credit Risk
4 7 (3.41%) Analytical Mindset
5 6 (2.93%) Product Ownership
6 5 (2.44%) Derivative
6 5 (2.44%) Onboarding
7 4 (1.95%) Self-Motivation
8 3 (1.46%) Data Protection Act
8 3 (1.46%) Distributed Computing
8 3 (1.46%) Enterprise Software
8 3 (1.46%) NHS
8 3 (1.46%) Reference Data
8 3 (1.46%) Renewable Energy
8 3 (1.46%) Tandem
8 3 (1.46%) Virtual Team
9 2 (0.98%) CMDB
9 2 (0.98%) CSOC
9 2 (0.98%) Market Risk
10 1 (0.49%) Fixed Income
Operating Systems
1 29 (14.15%) Windows
2 3 (1.46%) Windows 10
3 2 (0.98%) Linux
3 2 (0.98%) Unix
4 1 (0.49%) AIX
4 1 (0.49%) Android
Processes & Methodologies
1 72 (35.12%) Analytics
2 62 (30.24%) Problem-Solving
3 58 (28.29%) Visualisation
4 38 (18.54%) Agile
5 36 (17.56%) Business Intelligence
6 33 (16.10%) Mentoring
7 31 (15.12%) Data Visualisation
8 29 (14.15%) Data Analysis
9 28 (13.66%) Storytelling
10 27 (13.17%) Data Pipeline
11 26 (12.68%) Customer Intelligence
11 26 (12.68%) Root Cause Analysis
12 25 (12.20%) Decision-Making
13 23 (11.22%) Mathematics
14 20 (9.76%) Change Management
14 20 (9.76%) Customer-Centricity
15 19 (9.27%) Stakeholder Management
15 19 (9.27%) Statistics
16 18 (8.78%) Continuous Improvement
16 18 (8.78%) Requirements Gathering
Programming Languages
1 109 (53.17%) SQL
2 65 (31.71%) Python
3 26 (12.68%) C#
3 26 (12.68%) PL/SQL
4 25 (12.20%) VB.NET
5 16 (7.80%) T-SQL
6 7 (3.41%) R
7 4 (1.95%) Java
7 4 (1.95%) VBA
8 2 (0.98%) JavaScript
9 1 (0.49%) MATLAB
9 1 (0.49%) PowerShell
Qualifications
1 48 (23.41%) Degree
2 33 (16.10%) DBS Check
3 7 (3.41%) CRISC
4 6 (2.93%) CISM
4 6 (2.93%) Master's Degree
5 5 (2.44%) CISSP
5 5 (2.44%) Numerate Degree
5 5 (2.44%) SC Cleared
5 5 (2.44%) Security Cleared
6 4 (1.95%) ISO 27001 Lead Implementer
7 3 (1.46%) Computer Science Degree
8 2 (0.98%) CISMP
8 2 (0.98%) DV Cleared
9 1 (0.49%) A+ Certification
9 1 (0.49%) ACCA
9 1 (0.49%) CBAP
9 1 (0.49%) CIMA
9 1 (0.49%) ISEB
9 1 (0.49%) ISTQB
9 1 (0.49%) PMI Certification
Quality Assurance & Compliance
1 8 (3.90%) GRC
1 8 (3.90%) ISO/IEC 27001
1 8 (3.90%) PMO
2 7 (3.41%) NIST
3 6 (2.93%) Actionable Recommendations
3 6 (2.93%) PCI DSS
4 5 (2.44%) Accessibility
4 5 (2.44%) GDPR
5 4 (1.95%) COREP
6 3 (1.46%) Cyber Essentials
6 3 (1.46%) Cyber Essentials PLUS
6 3 (1.46%) Data Quality
7 2 (0.98%) QA
8 1 (0.49%) COBIT
8 1 (0.49%) IFRS
8 1 (0.49%) IFRS 9
8 1 (0.49%) SLA
System Software
1 7 (3.41%) Active Directory
2 2 (0.98%) Hyper-V
2 2 (0.98%) VMware Infrastructure
3 1 (0.49%) Virtual Servers
Systems Management
1 6 (2.93%) Microsoft Intune
2 2 (0.98%) QRadar
2 2 (0.98%) SCCM
3 1 (0.49%) Control-M
Vendors
1 44 (21.46%) Microsoft
2 28 (13.66%) Databricks
3 10 (4.88%) Google
3 10 (4.88%) ServiceNow
4 9 (4.39%) Salesforce
5 8 (3.90%) Aderant
6 7 (3.41%) Oracle
7 6 (2.93%) SolarWinds
8 5 (2.44%) Screaming Frog
9 4 (1.95%) SAP
10 3 (1.46%) BT
10 3 (1.46%) Cisco
10 3 (1.46%) Concur
10 3 (1.46%) IBM
10 3 (1.46%) Meraki
11 2 (0.98%) LogicMonitor
11 2 (0.98%) RedGate
11 2 (0.98%) VMware
12 1 (0.49%) Alteryx
12 1 (0.49%) Splunk