Co-Creation
UK
The table below provides summary statistics and contractor rates for jobs requiring Co-Creation skills. It covers contract job vacancies from the 6 months leading up to 22 October 2025, with comparisons to the same periods in the previous two years.
| 6 months to 22 Oct 2025 |
Same period 2024 | Same period 2023 | |
|---|---|---|---|
| Rank | 516 | 529 | 587 |
| Rank change year-on-year | +13 | +58 | +189 |
| Contract jobs citing Co-Creation | 48 | 29 | 43 |
| As % of all contract jobs in the UK | 0.14% | 0.078% | 0.090% |
| As % of the Processes & Methodologies category | 0.16% | 0.090% | 0.10% |
| Number of daily rates quoted | 35 | 16 | 33 |
| 10th Percentile | £473 | £403 | £403 |
| 25th Percentile | £481 | £509 | £446 |
| Median daily rate (50th Percentile) | £543 | £555 | £500 |
| Median % change year-on-year | -2.25% | +11.00% | -21.88% |
| 75th Percentile | £592 | £667 | £650 |
| 90th Percentile | £609 | £700 | £810 |
| UK excluding London median daily rate | £500 | £560 | £463 |
| % change year-on-year | -10.71% | +21.08% | -28.02% |
All Process and Methodology Skills
UK
Co-Creation falls under the Processes and Methodologies category. For comparison with the information above, the following table provides summary statistics for all contract job vacancies requiring process or methodology skills.
| Contract vacancies with a requirement for process or methodology skills | 30,307 | 32,084 | 42,189 |
| As % of all contract IT jobs advertised in the UK | 90.49% | 86.09% | 88.76% |
| Number of daily rates quoted | 18,872 | 19,308 | 28,607 |
| 10th Percentile | £300 | £310 | £313 |
| 25th Percentile | £405 | £413 | £425 |
| Median daily rate (50th Percentile) | £500 | £525 | £538 |
| Median % change year-on-year | -4.76% | -2.33% | -2.27% |
| 75th Percentile | £623 | £638 | £650 |
| 90th Percentile | £725 | £750 | £750 |
| UK excluding London median daily rate | £475 | £500 | £500 |
| % change year-on-year | -5.00% | - | - |
| Number of hourly rates quoted | 1,924 | 1,195 | 1,576 |
| 10th Percentile | £14.38 | £15.00 | £14.25 |
| 25th Percentile | £17.30 | £20.12 | £18.87 |
| Median hourly rate | £25.08 | £38.50 | £43.17 |
| Median % change year-on-year | -34.87% | -10.81% | +30.80% |
| 75th Percentile | £42.50 | £65.00 | £65.00 |
| 90th Percentile | £65.25 | £73.75 | £77.50 |
| UK excluding London median hourly rate | £22.27 | £39.68 | £42.50 |
| % change year-on-year | -43.89% | -6.64% | +57.52% |
Co-Creation
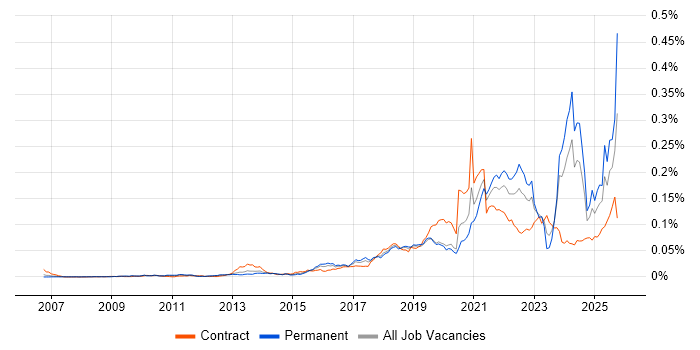
Job Vacancy Trend
Historical trend showing the proportion of contract IT job postings citing Co-Creation relative to all contract IT jobs advertised.

Co-Creation
Daily Rate Trend
Contractor daily rate distribution trend for jobs in the UK citing Co-Creation.

Co-Creation
Daily Rate Histogram
Daily rate distribution for jobs citing Co-Creation over the 6 months to 22 October 2025.
Co-Creation
Hourly Rate Trend
Contractor hourly rate distribution trend for jobs in the UK citing Co-Creation.

Co-Creation
Top 14 Contract Job Locations
The table below looks at the demand and provides a guide to the median contractor rates quoted in IT jobs citing Co-Creation within the UK over the 6 months to 22 October 2025. The 'Rank Change' column provides an indication of the change in demand within each location based on the same 6 month period last year.
| Location | Rank Change on Same Period Last Year |
Matching Contract IT Job Ads |
Median Daily Rate Past 6 Months |
Median Daily Rate % Change on Same Period Last Year |
Live Jobs |
|---|---|---|---|---|---|
| England | +21 | 38 | £543 | -9.58% | 149 |
| London | +24 | 23 | £534 | -11.04% | 89 |
| Work from Home | +32 | 15 | £576 | +4.73% | 56 |
| UK excluding London | -19 | 13 | £500 | -10.71% | 97 |
| North of England | -25 | 5 | £513 | -14.58% | 8 |
| Scotland | -1 | 3 | £471 | -28.95% | 2 |
| North West | -10 | 3 | £625 | +4.17% | 8 |
| South East | +9 | 2 | £442 | -1.89% | 68 |
| Midlands | -28 | 2 | £580 | - | 11 |
| North East | - | 2 | £475 | - | |
| South West | +13 | 1 | £475 | -20.83% | 3 |
| West Midlands | -22 | 1 | £600 | - | 4 |
| Yorkshire | - | 1 | £525 | - | |
| East Midlands | - | 1 | £560 | - | 6 |
Co-Creation
Co-Occurring Skills & Capabilities by Category
The following tables expand on the one above by listing co-occurrences grouped by category. They cover the same employment type, locality and period, with up to 20 co-occurrences shown in each category:
|
|
|||||||||||||||||||||||||||||||||||||||||||||||||||||||||||||||||||||||||||||||||||||||||||||||||||||||||||||||||||||||||||
|
|
|||||||||||||||||||||||||||||||||||||||||||||||||||||||||||||||||||||||||||||||||||||||||||||||||||||||||||||||||||||||||||
|
|
|||||||||||||||||||||||||||||||||||||||||||||||||||||||||||||||||||||||||||||||||||||||||||||||||||||||||||||||||||||||||||
|
|
|||||||||||||||||||||||||||||||||||||||||||||||||||||||||||||||||||||||||||||||||||||||||||||||||||||||||||||||||||||||||||
|
|
|||||||||||||||||||||||||||||||||||||||||||||||||||||||||||||||||||||||||||||||||||||||||||||||||||||||||||||||||||||||||||
|
|
|||||||||||||||||||||||||||||||||||||||||||||||||||||||||||||||||||||||||||||||||||||||||||||||||||||||||||||||||||||||||||
|
|
|||||||||||||||||||||||||||||||||||||||||||||||||||||||||||||||||||||||||||||||||||||||||||||||||||||||||||||||||||||||||||
|
|
|||||||||||||||||||||||||||||||||||||||||||||||||||||||||||||||||||||||||||||||||||||||||||||||||||||||||||||||||||||||||||
|
|
|||||||||||||||||||||||||||||||||||||||||||||||||||||||||||||||||||||||||||||||||||||||||||||||||||||||||||||||||||||||||||
