Cisco Contracts with Work from Home Options

Cisco
UK > Work from Home

The table below provides summary statistics for contract job vacancies with an option to work from home (WFH) and a requirement for knowledge and experience of Cisco products and/or services. Included is a benchmarking guide to the contractor rates offered in vacancies that have cited Cisco over the 6 months to 27 May 2024 with a comparison to the same period in the previous 2 years.

The figures below represent the IT contractor job market in general and are not representative of contractor rates within Cisco Systems, Inc.

6 months to
27 May 2024
Same period 2023 Same period 2022
Rank 85 72 118
Rank change year-on-year -13 +46 -5
Contract jobs citing Cisco 352 768 981
As % of all contract jobs with a WFH option 2.40% 3.13% 2.21%
As % of the Vendors category 5.68% 7.20% 5.59%
Number of daily rates quoted 225 498 671
10th Percentile £275 £338 £310
25th Percentile £350 £413 £400
Median daily rate (50th Percentile) £475 £500 £475
Median % change year-on-year -5.00% +5.26% +7.34%
75th Percentile £625 £609 £575
90th Percentile £709 £700 £638
UK median daily rate £475 £475 £450
% change year-on-year - +5.56% +12.15%
Number of hourly rates quoted 10 24 25
10th Percentile £13.25 £12.50 -
25th Percentile £14.22 £18.50 £20.75
Median hourly rate £21.25 £50.00 £26.00
Median % change year-on-year -57.50% +92.31% +30.00%
75th Percentile £29.06 £79.13 £40.75
90th Percentile £30.25 £80.78 £60.93
UK median hourly rate £26.25 £50.00 £23.91
% change year-on-year -47.50% +109.12% +19.55%

All Vendors
Work from Home

Cisco is in the Vendor Products and Services category. The following table is for comparison with the above and provides summary statistics for all contract job vacancies with a WFH option and a requirement for knowledge or experience of vendor products and services.

Contract vacancies with a requirement for knowledge or experience of vendor products and services 6,194 10,667 17,540
As % of all contract jobs with a WFH option 42.20% 43.49% 39.50%
Number of daily rates quoted 3,923 7,193 11,967
10th Percentile £325 £325 £344
25th Percentile £425 £425 £425
Median daily rate (50th Percentile) £525 £525 £525
Median % change year-on-year - - +9.38%
75th Percentile £625 £650 £625
90th Percentile £725 £743 £725
UK median daily rate £515 £525 £525
% change year-on-year -1.90% - +10.53%
Number of hourly rates quoted 204 252 254
10th Percentile £13.31 £16.70 £13.50
25th Percentile £16.50 £25.71 £19.58
Median hourly rate £28.75 £52.50 £39.75
Median % change year-on-year -45.24% +32.08% +52.88%
75th Percentile £51.69 £66.53 £56.13
90th Percentile £70.00 £80.23 £72.50
UK median hourly rate £22.00 £42.50 £21.50
% change year-on-year -48.24% +97.67% +2.38%

Cisco
Trend for Jobs with a WFH Option

Job vacancies with a work from home option citing Cisco as a proportion of all IT jobs advertised.
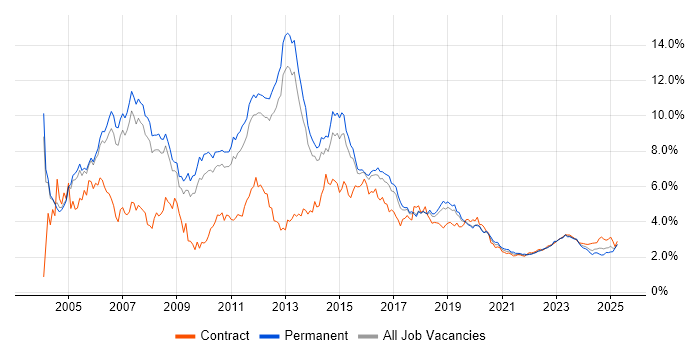
Cisco trend for jobs with a WFH option

Cisco
Daily Rate Trend for Jobs with a WFH Option

3-month moving average daily rate quoted in job vacancies with a work from home option citing Cisco.

Cisco daily rate for jobs with a WFH option

Cisco
Daily Rate Histogram for Jobs with a WFH Option

Daily rate distribution for jobs with a work from home option citing Cisco over the 6 months to 27 May 2024.

Cisco daily rate histogram for jobs with a WFH option

Cisco
Hourly Rate Trend for Jobs with a WFH Option

3-month moving average hourly rate quoted in job vacancies with a work from home option citing Cisco.

Cisco hourly rate for jobs with a WFH option

Cisco
Hourly Rate Histogram for Jobs with a WFH Option

Hourly rate distribution for jobs with a work from home option citing Cisco over the 6 months to 27 May 2024.

Cisco hourly rate histogram for jobs with a WFH option

Cisco
Co-occurring Skills and Capabilities with WFH Options by Category

The follow tables expand on the table above by listing co-occurrences grouped by category. The same employment type, locality and period is covered with up to 20 co-occurrences shown in each of the following categories:

Application Platforms
1 12 (3.41%) Microsoft Exchange
2 11 (3.13%) Confluence
3 2 (0.57%) nginx
3 2 (0.57%) OpenStack
3 2 (0.57%) SharePoint
4 1 (0.28%) Exchange Server 2007
4 1 (0.28%) Exchange Server 2010
4 1 (0.28%) IBM Notes
4 1 (0.28%) IIS
4 1 (0.28%) Skype for Business
Applications
1 7 (1.99%) Microsoft Office
2 6 (1.70%) Chatbot
3 4 (1.14%) Microsoft Excel
4 1 (0.28%) Microsoft PowerPoint
Cloud Services
1 44 (12.50%) Azure
2 42 (11.93%) AWS
3 21 (5.97%) GCP
4 17 (4.83%) Microsoft 365
5 14 (3.98%) Cloud Computing
6 8 (2.27%) SaaS
7 7 (1.99%) GitHub
7 7 (1.99%) IaaS
7 7 (1.99%) PaaS
7 7 (1.99%) Twilio
8 6 (1.70%) Entra ID
8 6 (1.70%) Nutanix
8 6 (1.70%) Rubrik
9 4 (1.14%) Virtual Private Cloud
10 3 (0.85%) Datadog
10 3 (0.85%) Power Platform
11 2 (0.57%) Amazon EKS
11 2 (0.57%) OneDrive
11 2 (0.57%) Route 53
12 1 (0.28%) Cloudflare
Communications & Networking
1 156 (44.32%) Firewall
2 92 (26.14%) WAN
3 70 (19.89%) BGP
4 69 (19.60%) LAN
5 61 (17.33%) Cisco ASA
6 59 (16.76%) OSPF
7 55 (15.63%) SD-WAN
8 52 (14.77%) VPN
9 51 (14.49%) Network Security
10 47 (13.35%) Cisco ISE
10 47 (13.35%) Cisco Nexus
11 38 (10.80%) MPLS
12 37 (10.51%) Wireless
13 30 (8.52%) EIGRP
14 28 (7.95%) IPsec
15 27 (7.67%) DNS
16 26 (7.39%) TCP/IP
17 25 (7.10%) Wi-Fi
18 24 (6.82%) Cisco Firepower
18 24 (6.82%) SAN
Database & Business Intelligence
1 5 (1.42%) SQL Server
2 3 (0.85%) Power BI
2 3 (0.85%) Relational Database
3 2 (0.57%) Amazon RDS
3 2 (0.57%) NonStop SQL
Development Applications
1 12 (3.41%) Sonatype Nexus
2 10 (2.84%) JIRA
3 7 (1.99%) Jenkins
4 6 (1.70%) Git
4 6 (1.70%) TeamCity
5 4 (1.14%) GitLab
5 4 (1.14%) Rational DOORS
General
1 84 (23.86%) Finance
2 60 (17.05%) Social Skills
3 39 (11.08%) Telecoms
4 33 (9.38%) Banking
5 17 (4.83%) Public Sector
6 15 (4.26%) Analytical Skills
7 12 (3.41%) Manufacturing
8 11 (3.13%) Presentation Skills
9 10 (2.84%) Retail
10 6 (1.70%) Billing
11 5 (1.42%) Aerospace
11 5 (1.42%) Organisational Skills
12 4 (1.14%) Aeronautics
12 4 (1.14%) Financial Institution
12 4 (1.14%) Legal
13 3 (0.85%) Documentation Skills
14 2 (0.57%) Electronics
14 2 (0.57%) Pharmaceutical
15 1 (0.28%) Law
15 1 (0.28%) Military
Job Titles
1 144 (40.91%) Network Engineer
2 53 (15.06%) Architect
3 33 (9.38%) Senior
4 30 (8.52%) Network Architect
5 26 (7.39%) Cisco Engineer
6 23 (6.53%) Consultant
7 18 (5.11%) Cisco Network Engineer
7 18 (5.11%) Solutions Architect
7 18 (5.11%) Support Engineer
8 15 (4.26%) Senior Network Engineer
9 12 (3.41%) Network Consultant
10 10 (2.84%) Project Manager
11 9 (2.56%) Developer
11 9 (2.56%) Infrastructure Engineer
12 8 (2.27%) Analyst
12 8 (2.27%) Automation Engineer
12 8 (2.27%) Operations Engineer
12 8 (2.27%) Security Engineer
13 7 (1.99%) SC Cleared Network Engineer
13 7 (1.99%) Senior Architect
Libraries, Frameworks & Software Standards
1 10 (2.84%) FIX Protocol
1 10 (2.84%) LDAP
1 10 (2.84%) Web Services
2 7 (1.99%) Middleware
3 6 (1.70%) Jinja
4 5 (1.42%) JSON
5 3 (0.85%) 802.1X
5 3 (0.85%) Django
5 3 (0.85%) EDI
5 3 (0.85%) REST
5 3 (0.85%) RESTful
5 3 (0.85%) YANG
6 2 (0.57%) Elastic Stack
6 2 (0.57%) Regular Expression
6 2 (0.57%) Ultra Messaging
6 2 (0.57%) XML
7 1 (0.28%) XMPP
Miscellaneous
1 42 (11.93%) Data Centre
2 16 (4.55%) Video Conferencing
3 13 (3.69%) Clustering
4 11 (3.13%) Management Information System
5 8 (2.27%) IVR
5 8 (2.27%) Operational Technology
5 8 (2.27%) Replication
6 6 (1.70%) Data Protection Act
6 6 (1.70%) PKI
6 6 (1.70%) Public Cloud
7 5 (1.42%) Hybrid Cloud
8 4 (1.14%) Cloud Native
9 3 (0.85%) CCTV
9 3 (0.85%) Distributed Denial-of-Service
9 3 (0.85%) Enterprise Software
9 3 (0.85%) IoT
9 3 (0.85%) Linux Command Line
9 3 (0.85%) NHS
9 3 (0.85%) SCADA
10 2 (0.57%) Foreign Exchange (FX)
Operating Systems
1 42 (11.93%) Windows
2 22 (6.25%) Linux
3 13 (3.69%) Windows Server
4 11 (3.13%) Windows Server 2016
5 9 (2.56%) Solaris
6 7 (1.99%) Red Hat Enterprise Linux
6 7 (1.99%) Windows 10
6 7 (1.99%) Windows Server 2012
7 6 (1.70%) Mac OS
7 6 (1.70%) Oracle Linux
7 6 (1.70%) Unix
8 3 (0.85%) AIX
8 3 (0.85%) Mac OS X
9 1 (0.28%) Android
9 1 (0.28%) Windows 7
Processes & Methodologies
1 38 (10.80%) Migration
2 36 (10.23%) ITIL
3 34 (9.66%) Agile
4 30 (8.52%) DevOps
4 30 (8.52%) Problem-Solving
5 27 (7.67%) Change Management
6 26 (7.39%) Load Balancing
6 26 (7.39%) Network Design
7 23 (6.53%) High Availability
8 20 (5.68%) Low Latency
9 19 (5.40%) Network Management
10 17 (4.83%) Roadmaps
10 17 (4.83%) Stakeholder Management
11 16 (4.55%) Network Architecture
11 16 (4.55%) Network Virtualisation
12 15 (4.26%) Disaster Recovery
13 14 (3.98%) Computer Science
13 14 (3.98%) Customer Service
13 14 (3.98%) Cybersecurity
13 14 (3.98%) ITSM
Programming Languages
1 43 (12.22%) Python
2 13 (3.69%) PowerShell
3 12 (3.41%) Bash
4 11 (3.13%) SQL
5 8 (2.27%) Perl
6 6 (1.70%) Tcl
7 3 (0.85%) Java
7 3 (0.85%) JavaScript
7 3 (0.85%) T-SQL
Qualifications
1 140 (39.77%) Cisco Certification
2 108 (30.68%) CCNP
3 65 (18.47%) Security Cleared
4 59 (16.76%) CCNA
5 48 (13.64%) CCIE
6 45 (12.78%) SC Cleared
7 26 (7.39%) Degree
8 14 (3.98%) JNCIA
9 12 (3.41%) AWS Certification
9 12 (3.41%) DV Cleared
10 9 (2.56%) Azure Certification
10 9 (2.56%) Computer Science Degree
11 8 (2.27%) BPSS Clearance
11 8 (2.27%) CCDP
11 8 (2.27%) Microsoft Certification
12 7 (1.99%) CISM
12 7 (1.99%) CISSP
12 7 (1.99%) Master's Degree
13 6 (1.70%) AWS Certified Solutions Architect
13 6 (1.70%) JNCIS
Quality Assurance & Compliance
1 19 (5.40%) SLA
2 10 (2.84%) GDPR
3 8 (2.27%) PCI DSS
3 8 (2.27%) QA
4 7 (1.99%) Sarbanes-Oxley
5 5 (1.42%) ISO/IEC 27001
5 5 (1.42%) PMO
6 4 (1.14%) HIPAA
6 4 (1.14%) SOC 2
7 2 (0.57%) Disclosure Scotland
8 1 (0.28%) GLBA
8 1 (0.28%) ISAE 3402
8 1 (0.28%) ISO 9000
8 1 (0.28%) ISO/IEC 27002 (supersedes ISO/IEC 17799)
8 1 (0.28%) NCSC
8 1 (0.28%) NIST
System Software
1 37 (10.51%) VMware Infrastructure
2 31 (8.81%) Active Directory
3 27 (7.67%) VMware NSX
4 12 (3.41%) Firmware
5 11 (3.13%) vSphere
6 6 (1.70%) Docker
7 5 (1.42%) Hyper-V
8 4 (1.14%) Virtual Machines
9 2 (0.57%) Squid
9 2 (0.57%) VMware ESXi
9 2 (0.57%) XenApp
10 1 (0.28%) BitLocker
10 1 (0.28%) Microsoft Virtual Server
10 1 (0.28%) Virtual Desktop
10 1 (0.28%) Virtual Servers
Systems Management
1 37 (10.51%) Ansible
2 20 (5.68%) Terraform
3 16 (4.55%) FortiGate
4 10 (2.84%) Kubernetes
5 9 (2.56%) EMC NetWorker
5 9 (2.56%) SCCM
6 6 (1.70%) Netcool
6 6 (1.70%) Tivoli
6 6 (1.70%) Tivoli Storage Manager
7 5 (1.42%) Microsoft Intune
8 4 (1.14%) AirWatch
8 4 (1.14%) Nessus
8 4 (1.14%) VxRail
9 3 (0.85%) CSIRT
9 3 (0.85%) Kibana
9 3 (0.85%) SolarWinds Orion
9 3 (0.85%) vCenter Server
10 2 (0.57%) HAProxy
10 2 (0.57%) ITRS Geneos
10 2 (0.57%) Puppet
Vendors
1 84 (23.86%) Palo Alto
2 55 (15.63%) F5
3 51 (14.49%) Fortinet
4 46 (13.07%) Juniper
5 44 (12.50%) VMware
6 39 (11.08%) Microsoft
7 36 (10.23%) SolarWinds
8 33 (9.38%) CheckPoint
9 31 (8.81%) Citrix
10 25 (7.10%) HP
11 21 (5.97%) Splunk
12 20 (5.68%) Meraki
13 18 (5.11%) Dell
14 16 (4.55%) Avaya
14 16 (4.55%) EMC
15 15 (4.26%) Aruba
16 14 (3.98%) Arista
16 14 (3.98%) Zscaler
17 13 (3.69%) ServiceNow
18 12 (3.41%) Genesys