Miro Jobs in England

Miro
UK > England

The table below provides summary statistics for permanent job vacancies advertised in England requiring Miro skills. It includes a benchmarking guide to the annual salaries offered in vacancies that cited Miro over the 6 months leading up to 1 June 2025, comparing them to the same period in the previous two years.

6 months to
1 Jun 2025
Same period 2024 Same period 2023
Rank 574 765 730
Rank change year-on-year +191 -35 +96
Permanent jobs citing Miro 109 81 166
As % of all permanent jobs advertised in England 0.22% 0.090% 0.20%
As % of the Cloud Services category 0.77% 0.26% 0.45%
Number of salaries quoted 23 29 44
10th Percentile £38,000 £30,950 £40,256
25th Percentile - £37,500 £44,063
Median annual salary (50th Percentile) £48,000 £52,500 £57,500
Median % change year-on-year -8.57% -8.70% -16.26%
75th Percentile £58,125 £58,750 £70,000
90th Percentile £68,750 £70,000 £77,500
UK median annual salary £48,000 £55,000 £57,500
% change year-on-year -12.73% -4.35% -11.54%

All Cloud Skills
England

Miro falls under the Cloud Services category. For comparison with the information above, the following table provides summary statistics for all permanent job vacancies requiring cloud computing skills in England.

Permanent vacancies with a requirement for cloud computing skills 14,100 30,947 36,769
As % of all permanent jobs advertised in England 28.50% 34.23% 43.40%
Number of salaries quoted 9,472 24,394 24,790
10th Percentile £31,250 £30,000 £34,595
25th Percentile £42,500 £41,250 £46,250
Median annual salary (50th Percentile) £60,000 £57,500 £65,000
Median % change year-on-year +4.35% -11.54% +4.00%
75th Percentile £82,500 £77,500 £85,000
90th Percentile £105,000 £97,500 £105,000
UK median annual salary £60,000 £57,500 £65,000
% change year-on-year +4.35% -11.54% +4.00%

Miro
Job Vacancy Trend in England

Job postings citing Miro as a proportion of all IT jobs advertised in England.
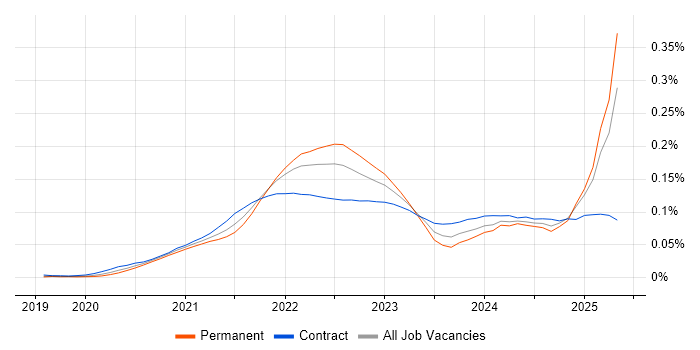
Job vacancy trend for Miro in England

Miro
Salary Trend in England

3-month moving average salary quoted in jobs citing Miro in England.

Salary trend for Miro in England

Miro
Salary Histogram in England

Salary distribution for jobs citing Miro in England over the 6 months to 1 June 2025.

Salary histogram for Miro in England

Miro
Job Locations in England

The table below looks at the demand and provides a guide to the median salaries quoted in IT jobs citing Miro within the England region over the 6 months to 1 June 2025. The 'Rank Change' column provides an indication of the change in demand within each location based on the same 6 month period last year.

Location Rank Change
on Same Period
Last Year
Matching
Permanent
IT Job Ads
Median Salary
Past 6 Months
Median Salary
% Change
on Same Period
Last Year
Live
Jobs
London +134 40 £55,000 +15.79% 85
Midlands +68 11 £48,000 +37.14% 152
South East +76 10 - - 185
West Midlands +72 10 £48,000 +29.73% 81
North of England +34 9 £51,250 -16.33% 179
North West +2 7 £57,500 +9.52% 79
East of England +47 6 - - 124
South West +111 2 - - 92
Yorkshire +53 2 £45,000 -35.71% 76
East Midlands +26 1 - - 61
Miro
UK

Miro
Co-occurring Skills and Capabilities in England by Category

The follow tables expand on the table above by listing co-occurrences grouped by category. The same employment type, locality and period is covered with up to 20 co-occurrences shown in each of the following categories:

Application Platforms
1 77 (70.64%) Confluence
2 1 (0.92%) CMS
2 1 (0.92%) Headless CMS
2 1 (0.92%) SharePoint
Applications
1 82 (75.23%) Microsoft Office
2 10 (9.17%) MS Visio
3 6 (5.50%) Microsoft Excel
3 6 (5.50%) Microsoft PowerPoint
4 3 (2.75%) Adobe XD
5 1 (0.92%) Microsoft Project
Business Applications
1 8 (7.34%) Salesforce CRM
Cloud Services
1 72 (66.06%) Asana
2 13 (11.93%) Figma
3 8 (7.34%) Slack
4 5 (4.59%) Azure
5 4 (3.67%) Google Docs
5 4 (3.67%) Google Sheets
5 4 (3.67%) Google Workspace
6 3 (2.75%) AWS
6 3 (2.75%) Azure Key Vault
6 3 (2.75%) Entra ID
6 3 (2.75%) GCP
6 3 (2.75%) GitHub
6 3 (2.75%) SaaS
7 2 (1.83%) Azure DevOps
7 2 (1.83%) Power Platform
8 1 (0.92%) Dropbox
8 1 (0.92%) Dynamics 365
8 1 (0.92%) Microsoft 365
8 1 (0.92%) OneDrive
8 1 (0.92%) Power Automate
Communications & Networking
1 72 (66.06%) Broadband
Database & Business Intelligence
1 1 (0.92%) Power BI
Development Applications
1 95 (87.16%) JIRA
2 7 (6.42%) Balsamiq
3 3 (2.75%) Axure RP
General
1 86 (78.90%) Finance
2 72 (66.06%) Influencing Skills
3 11 (10.09%) Social Skills
4 9 (8.26%) Analytical Skills
4 9 (8.26%) Inclusion and Diversity
5 4 (3.67%) Financial Institution
5 4 (3.67%) Law
5 4 (3.67%) Marketing
5 4 (3.67%) Publishing
6 3 (2.75%) Banking
6 3 (2.75%) Presentation Skills
6 3 (2.75%) Private Banking
6 3 (2.75%) Public Sector
7 1 (0.92%) Digital Health
7 1 (0.92%) Pharmaceutical
Job Titles
1 78 (71.56%) Analyst
2 72 (66.06%) Product Analyst
3 12 (11.01%) Product Owner
4 8 (7.34%) Agile Product Owner
5 6 (5.50%) Business Analyst
6 5 (4.59%) Senior
7 4 (3.67%) Content Strategist
7 4 (3.67%) Designer
7 4 (3.67%) Digital Product Owner
7 4 (3.67%) Senior Analyst
7 4 (3.67%) Senior Business Analyst
8 3 (2.75%) Architect
8 3 (2.75%) IT Architect
8 3 (2.75%) IT Director
8 3 (2.75%) IT Security Architect
8 3 (2.75%) Scrum Master
8 3 (2.75%) Security Architect
8 3 (2.75%) Security Solutions Architect
8 3 (2.75%) SEO Strategist
8 3 (2.75%) Solutions Architect
Libraries, Frameworks & Software Standards
1 3 (2.75%) RESTful
2 1 (0.92%) CSS
2 1 (0.92%) HTML
2 1 (0.92%) Microsoft Graph
Miscellaneous
1 94 (86.24%) Product Ownership
2 72 (66.06%) Over-the-Top Content
2 72 (66.06%) Self-Motivation
2 72 (66.06%) Video\Live Streaming
3 4 (3.67%) Management Information System
4 3 (2.75%) Cloud Native
4 3 (2.75%) Cloud Security Posture
4 3 (2.75%) Machine to Machine
4 3 (2.75%) Security Posture
5 2 (1.83%) Onboarding
6 1 (0.92%) Animation
6 1 (0.92%) Data Centre
6 1 (0.92%) Life Science
6 1 (0.92%) Mobile App
6 1 (0.92%) PMI
Operating Systems
1 1 (0.92%) Windows
1 1 (0.92%) Windows 10
Processes & Methodologies
1 103 (94.50%) Agile
2 88 (80.73%) Roadmaps
3 85 (77.98%) Stakeholder Management
4 80 (73.39%) CRM
5 72 (66.06%) Customer Service
5 72 (66.06%) Customer-Centricity
5 72 (66.06%) Product Management
6 18 (16.51%) Scrum
7 15 (13.76%) Backlog Management
8 13 (11.93%) User Experience
9 12 (11.01%) Backlog Prioritisation
9 12 (11.01%) Mentoring
9 12 (11.01%) Product Backlog
9 12 (11.01%) Stakeholder Engagement
10 11 (10.09%) Coaching
11 10 (9.17%) Kanban
11 10 (9.17%) Problem-Solving
11 10 (9.17%) Project Management
11 10 (9.17%) Six Sigma
12 9 (8.26%) Scaled Agile Framework
Programming Languages
1 4 (3.67%) PowerShell
2 3 (2.75%) Python
3 1 (0.92%) JavaScript
3 1 (0.92%) SQL
Qualifications
1 17 (15.60%) Degree
2 3 (2.75%) (ISC)2 CCSP
2 3 (2.75%) CCSP
2 3 (2.75%) Cisco Certification
2 3 (2.75%) CISSP
3 2 (1.83%) CBAP
3 2 (1.83%) Microsoft Certification
4 1 (0.92%) CSPO
4 1 (0.92%) ISEB
4 1 (0.92%) PMI Certification
4 1 (0.92%) SC Cleared
4 1 (0.92%) Security Cleared
4 1 (0.92%) Six Sigma Green Belt
Quality Assurance & Compliance
1 4 (3.67%) GDPR
2 3 (2.75%) Accessibility
2 3 (2.75%) ISO/IEC 27001
2 3 (2.75%) NIST
2 3 (2.75%) SOC 2
2 3 (2.75%) WCAG
3 1 (0.92%) HIPAA
Systems Management
1 3 (2.75%) Progress Chef
1 3 (2.75%) Puppet
1 3 (2.75%) Terraform
Vendors
1 91 (83.49%) Microsoft
2 83 (76.15%) Salesforce
3 11 (10.09%) Google
4 3 (2.75%) Adobe
4 3 (2.75%) Alibaba
4 3 (2.75%) SAP
4 3 (2.75%) ServiceNow
5 1 (0.92%) Atlassian
5 1 (0.92%) Bloomberg