Influencing Skills Jobs in England

Influencing Skills
UK > England

The table below looks at the prevalence of the term Influencing Skills in permanent job vacancies in England. Included is a benchmarking guide to the salaries offered in vacancies that cited Influencing Skills over the 6 months leading up to 26 July 2024, comparing them to the same period in the previous two years.

6 months to
26 Jul 2024
Same period 2023 Same period 2022
Rank 171 212 233
Rank change year-on-year +41 +21 +39
Permanent jobs citing Influencing Skills 1,259 1,234 2,630
As % of all permanent jobs advertised in England 1.61% 1.74% 1.79%
As % of the General category 2.81% 2.63% 2.65%
Number of salaries quoted 363 525 1,333
10th Percentile £38,150 £39,294 £36,250
25th Percentile £42,202 £50,000 £45,000
Median annual salary (50th Percentile) £56,075 £65,000 £59,140
Median % change year-on-year -13.73% +9.91% -5.38%
75th Percentile £73,886 £85,000 £75,000
90th Percentile £90,000 £95,000 £95,000
UK median annual salary £56,075 £62,500 £59,064
% change year-on-year -10.28% +5.82% -2.01%

All General Skills
England

Influencing Skills falls under the General Skills category. For comparison with the information above, the following table provides summary statistics for all permanent job vacancies requiring common skills in England.

Permanent vacancies with a requirement for common skills 44,799 46,891 99,241
As % of all permanent jobs advertised in England 57.17% 65.97% 67.50%
Number of salaries quoted 28,228 29,742 48,838
10th Percentile £28,500 £32,000 £32,500
25th Percentile £37,500 £43,250 £43,500
Median annual salary (50th Percentile) £55,000 £60,000 £60,000
Median % change year-on-year -8.33% - +4.35%
75th Percentile £73,886 £82,500 £80,000
90th Percentile £95,000 £105,000 £100,000
UK median annual salary £54,000 £60,000 £60,000
% change year-on-year -10.00% - +6.19%

Influencing Skills
Job Vacancy Trend in England

Job postings citing Influencing Skills as a proportion of all IT jobs advertised in England.
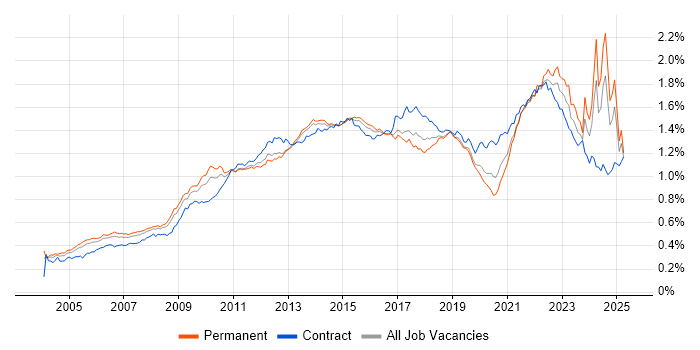
Job vacancy trend for Influencing Skills in England

Influencing Skills
Salary Trend in England

3-month moving average salary quoted in jobs citing Influencing Skills in England.

Salary trend for Influencing Skills in England

Influencing Skills
Salary Histogram in England

Salary distribution for jobs citing Influencing Skills in England over the 6 months to 26 July 2024.

Salary histogram for Influencing Skills in England

Influencing Skills
Job Locations in England

The table below looks at the demand and provides a guide to the median salaries quoted in IT jobs citing Influencing Skills within the England region over the 6 months to 26 July 2024. The 'Rank Change' column provides an indication of the change in demand within each location based on the same 6 month period last year.

Location Rank Change
on Same Period
Last Year
Matching
Permanent
IT Job Ads
Median Salary
Past 6 Months
Median Salary
% Change
on Same Period
Last Year
Live
Jobs
London +104 472 £65,000 -11.21% 68
South East +80 298 £49,500 -20.80% 40
Midlands -15 225 £57,500 +4.55% 31
West Midlands +9 194 £57,500 +4.55% 19
North of England -111 120 £45,000 -22.69% 54
South West -25 75 £60,000 +4.35% 33
North West -109 60 £42,500 -22.73% 31
East of England +7 44 £55,528 +0.96% 19
Yorkshire -22 44 £51,156 -21.72% 17
East Midlands -46 30 £57,500 -20.69% 12
North East +2 16 £50,000 +16.28% 10
Influencing Skills
UK

Influencing Skills
Co-occurring Skills and Capabilities in England by Category

The follow tables expand on the table above by listing co-occurrences grouped by category. The same employment type, locality and period is covered with up to 20 co-occurrences shown in each of the following categories:

Application Platforms
1 12 (0.95%) Confluence
2 11 (0.87%) SharePoint
3 6 (0.48%) SAS
4 1 (0.079%) CMS
4 1 (0.079%) Liferay
4 1 (0.079%) Microsoft Exchange
Applications
1 506 (40.19%) Microsoft Excel
2 150 (11.91%) Microsoft Office
3 37 (2.94%) Microsoft PowerPoint
4 8 (0.64%) Microsoft Project
4 8 (0.64%) MS Visio
5 7 (0.56%) Spreadsheet
6 4 (0.32%) SPSS
7 2 (0.16%) Adobe Illustrator
7 2 (0.16%) Photoshop
8 1 (0.079%) Adobe Captivate
8 1 (0.079%) Adobe Creative Suite
8 1 (0.079%) CATIA
8 1 (0.079%) NASTRAN
8 1 (0.079%) Oracle Smart View
8 1 (0.079%) Sketch
Business Applications
1 5 (0.40%) Workday HCM
2 2 (0.16%) Dynamics CRM
2 2 (0.16%) NEC Housing
3 1 (0.079%) Data Workbench
3 1 (0.079%) Dynamics AX
3 1 (0.079%) Exchequer
3 1 (0.079%) Salesforce CRM
3 1 (0.079%) Shopify
3 1 (0.079%) Teamcenter
Cloud Services
1 63 (5.00%) Azure
2 36 (2.86%) Power Platform
3 17 (1.35%) AWS
3 17 (1.35%) Azure DevOps
4 15 (1.19%) GCP
5 11 (0.87%) Azure Data Factory
6 10 (0.79%) Azure Service Bus
7 9 (0.71%) PowerApps
7 9 (0.71%) WhatsApp
8 8 (0.64%) Azure AKS
8 8 (0.64%) Azure App Service
8 8 (0.64%) SaaS
9 7 (0.56%) Microsoft 365
10 6 (0.48%) Azure Key Vault
10 6 (0.48%) PaaS
11 5 (0.40%) GitHub
11 5 (0.40%) IaaS
12 3 (0.24%) Datadog
12 3 (0.24%) Dynamics 365
12 3 (0.24%) Pulumi
Communications & Networking
1 449 (35.66%) Broadband
2 9 (0.71%) Firewall
3 6 (0.48%) DNS
3 6 (0.48%) WAN
4 5 (0.40%) LAN
4 5 (0.40%) Wi-Fi
5 3 (0.24%) Intranet
5 3 (0.24%) Structured Cabling
5 3 (0.24%) VLAN
5 3 (0.24%) VPN
6 2 (0.16%) Wireless
7 1 (0.079%) 4G
7 1 (0.079%) 5G
7 1 (0.079%) DHCP
7 1 (0.079%) IKE
Database & Business Intelligence
1 26 (2.07%) Power BI
2 19 (1.51%) SQL Server
3 9 (0.71%) Tableau
4 8 (0.64%) Data Lake
4 8 (0.64%) Data Mining
5 6 (0.48%) Delta Lake
5 6 (0.48%) SQL Server Reporting Services
6 5 (0.40%) Azure SQL Database
6 5 (0.40%) Electronic Patient Records
6 5 (0.40%) Power Query
6 5 (0.40%) PowerPivot
6 5 (0.40%) Qlik Sense
6 5 (0.40%) SQL Server Integration Services
7 4 (0.32%) Data Mart
7 4 (0.32%) PostgreSQL
8 3 (0.24%) Metadata
9 2 (0.16%) NoSQL
10 1 (0.079%) Oracle BI Publisher
10 1 (0.079%) Redis
10 1 (0.079%) Relational Database
Development Applications
1 18 (1.43%) Git
2 16 (1.27%) JIRA
3 15 (1.19%) Cucumber
3 15 (1.19%) Jenkins
4 12 (0.95%) Selenium
5 8 (0.64%) TeamCity
6 6 (0.48%) Maven
7 5 (0.40%) Sonatype Nexus
7 5 (0.40%) Spinnaker
8 4 (0.32%) Gradle
9 2 (0.16%) Cypress.io
9 2 (0.16%) SonarQube
10 1 (0.079%) Appium
10 1 (0.079%) Bitbucket
10 1 (0.079%) JMeter
10 1 (0.079%) JUnit
10 1 (0.079%) Mocha
10 1 (0.079%) Rational DOORS
10 1 (0.079%) Sinon.JS
10 1 (0.079%) SpecFlow
General
1 982 (78.00%) Social Skills
2 720 (57.19%) Analytical Skills
3 680 (54.01%) Finance
4 132 (10.48%) Organisational Skills
5 112 (8.90%) Inclusion and Diversity
6 75 (5.96%) Legal
7 66 (5.24%) Retail
8 59 (4.69%) Presentation Skills
8 59 (4.69%) Public Sector
9 52 (4.13%) Manufacturing
10 51 (4.05%) Marketing
11 28 (2.22%) Law
12 20 (1.59%) Banking
12 20 (1.59%) Games
13 17 (1.35%) Aerospace
14 15 (1.19%) Local Government
14 15 (1.19%) Telecoms
15 11 (0.87%) Automotive
15 11 (0.87%) Pharmaceutical
16 10 (0.79%) Investment Banking
Job Titles
1 634 (50.36%) Analyst
2 333 (26.45%) Senior
3 240 (19.06%) Senior Analyst
4 116 (9.21%) Product Analyst
4 116 (9.21%) Sales Analyst
5 113 (8.98%) Commercial Analyst
5 113 (8.98%) Financial Analyst
6 106 (8.42%) Project Manager
7 65 (5.16%) Lead
8 50 (3.97%) Senior Manager
9 48 (3.81%) Architect
10 33 (2.62%) IT Manager
10 33 (2.62%) Product Manager
11 29 (2.30%) Solutions Architect
12 28 (2.22%) Business Analyst
13 20 (1.59%) Data Steward
13 20 (1.59%) Service Manager
14 16 (1.27%) Senior IT Manager
15 15 (1.19%) IT Services Manager
16 14 (1.11%) Business Manager
Libraries, Frameworks & Software Standards
1 25 (1.99%) HTML
2 17 (1.35%) .NET
3 12 (0.95%) YAML
4 11 (0.87%) .NET Framework
4 11 (0.87%) ASP.NET
4 11 (0.87%) CSS
5 10 (0.79%) .NET Core
5 10 (0.79%) Gherkin
5 10 (0.79%) RESTful
6 8 (0.64%) ASP.NET 2.0
6 8 (0.64%) ASP.NET Web API
6 8 (0.64%) Blazor
6 8 (0.64%) Entity Framework
6 8 (0.64%) HTML5
6 8 (0.64%) JSON
6 8 (0.64%) Razor View Engine
6 8 (0.64%) XML
7 6 (0.48%) Middleware
8 5 (0.40%) React
8 5 (0.40%) SailPoint
Miscellaneous
1 58 (4.61%) Management Information System
2 55 (4.37%) Onboarding
3 35 (2.78%) Product Ownership
4 21 (1.67%) Analytical Mindset
5 18 (1.43%) FMCG
6 14 (1.11%) Cyberattack
6 14 (1.11%) Self-Motivation
7 11 (0.87%) PMI
7 11 (0.87%) Social Media
8 10 (0.79%) Cloud Native
8 10 (0.79%) Virtual Team
9 9 (0.71%) IoT
9 9 (0.71%) Robotics
10 8 (0.64%) Freedom of Information
11 7 (0.56%) NHS
12 6 (0.48%) Data Centre
12 6 (0.48%) Data Protection Act
12 6 (0.48%) Digital Signage
12 6 (0.48%) Driving Licence
12 6 (0.48%) Mobile App
Operating Systems
1 13 (1.03%) Windows
2 9 (0.71%) Windows Server
3 4 (0.32%) Android
3 4 (0.32%) Apple iOS
3 4 (0.32%) Linux
4 1 (0.079%) CentOS
4 1 (0.079%) Ubuntu
4 1 (0.079%) Unix
4 1 (0.079%) Windows 10
4 1 (0.079%) Windows Server 2012
Processes & Methodologies
1 629 (49.96%) Agile
2 574 (45.59%) Mentoring
3 542 (43.05%) Decision-Making
4 482 (38.28%) Business Case
5 464 (36.85%) Actionable Insight
6 453 (35.98%) Budgeting
7 448 (35.58%) Budgeting and Forecasting
8 309 (24.54%) Problem-Solving
9 206 (16.36%) Project Management
10 193 (15.33%) Continuous Improvement
11 147 (11.68%) Customer Service
12 143 (11.36%) Customer Requirements
13 126 (10.01%) Mathematics
14 120 (9.53%) Stakeholder Management
15 99 (7.86%) Analytics
15 99 (7.86%) Coaching
16 91 (7.23%) Roadmaps
17 88 (6.99%) Risk Management
18 73 (5.80%) DevOps
18 73 (5.80%) Project Delivery
Programming Languages
1 50 (3.97%) SQL
2 17 (1.35%) T-SQL
3 16 (1.27%) Python
4 14 (1.11%) JavaScript
5 11 (0.87%) C#
6 10 (0.79%) VBA
7 9 (0.71%) Java
7 9 (0.71%) SystemVerilog
8 6 (0.48%) PowerShell
9 4 (0.32%) C
10 3 (0.24%) C++
10 3 (0.24%) Perl
10 3 (0.24%) PHP
10 3 (0.24%) R
10 3 (0.24%) Shell Script
10 3 (0.24%) TypeScript
10 3 (0.24%) VB
11 1 (0.079%) Bicep
11 1 (0.079%) Clipper
Qualifications
1 450 (35.74%) ACCA
1 450 (35.74%) CIMA
2 304 (24.15%) Degree
3 79 (6.27%) Security Cleared
4 29 (2.30%) DV Cleared
5 28 (2.22%) SC Cleared
6 22 (1.75%) CISSP
7 19 (1.51%) PMI Certification
8 18 (1.43%) Computer Science Degree
9 15 (1.19%) CRISC
10 14 (1.11%) DBS Check
11 12 (0.95%) Master's Degree
12 9 (0.71%) PMP
12 9 (0.71%) TOGAF Certification
13 7 (0.56%) CISM
14 6 (0.48%) BPSS Clearance
14 6 (0.48%) CISA
15 5 (0.40%) Numerate Degree
16 4 (0.32%) Azure Certification
16 4 (0.32%) CIPD
Quality Assurance & Compliance
1 41 (3.26%) QA
2 37 (2.94%) Data Quality
3 23 (1.83%) PMO
4 17 (1.35%) ISO/IEC 27001
5 16 (1.27%) GDPR
6 13 (1.03%) Cyber Essentials
7 9 (0.71%) GRC
8 7 (0.56%) COBIT
9 6 (0.48%) Accessibility
9 6 (0.48%) NCSC
9 6 (0.48%) SLA
10 4 (0.32%) ISO 14001
11 3 (0.24%) Cyber Essentials PLUS
11 3 (0.24%) ISO 9001
11 3 (0.24%) NIST
12 2 (0.16%) COSHH
12 2 (0.16%) Disclosure Scotland
12 2 (0.16%) IASME
12 2 (0.16%) ITGC
12 2 (0.16%) PCI DSS
System Software
1 9 (0.71%) Docker
2 5 (0.40%) Active Directory
3 2 (0.16%) Hyper-V
3 2 (0.16%) Microsoft Virtual Server
3 2 (0.16%) Virtual Servers
3 2 (0.16%) VMware Infrastructure
4 1 (0.079%) IAG
4 1 (0.079%) Virtual Machines
Systems Management
1 17 (1.35%) Kubernetes
2 10 (0.79%) Terraform
3 9 (0.71%) SCOM
4 5 (0.40%) Functional Safety
4 5 (0.40%) Prometheus
5 4 (0.32%) Ansible
5 4 (0.32%) Grafana
5 4 (0.32%) Progress Chef
6 3 (0.24%) Kibana
7 1 (0.079%) FortiGate
7 1 (0.079%) Microsoft Intune
7 1 (0.079%) WSUS
Vendors
1 535 (42.49%) Microsoft
2 24 (1.91%) IFS
3 22 (1.75%) Workday
4 21 (1.67%) ServiceNow
5 13 (1.03%) Databricks
6 12 (0.95%) Cadence
7 10 (0.79%) SAP
8 9 (0.71%) Google
8 9 (0.71%) Synopsys
9 6 (0.48%) Salesforce
10 5 (0.40%) VMware
11 4 (0.32%) Adobe
12 3 (0.24%) Ariba
12 3 (0.24%) HP
12 3 (0.24%) Oracle
12 3 (0.24%) ScienceLogic
13 2 (0.16%) Dynatrace
13 2 (0.16%) Meraki
13 2 (0.16%) NEC
13 2 (0.16%) Splunk