Customer-Centricity Jobs in England

Customer-Centric
UK > England

The table below provides summary statistics for permanent job vacancies advertised in England requiring Customer-Centricity skills. It includes a benchmarking guide to the annual salaries offered in vacancies that cited Customer-Centricity over the 6 months leading up to 11 June 2025, comparing them to the same period in the previous two years.

6 months to
11 Jun 2025
Same period 2024 Same period 2023
Rank 300 367 278
Rank change year-on-year +67 -89 -15
Permanent jobs citing Customer-Centricity 519 654 1,074
As % of all permanent jobs advertised in England 1.05% 0.69% 1.30%
As % of the Processes & Methodologies category 1.13% 0.83% 1.36%
Number of salaries quoted 236 426 506
10th Percentile £26,813 £26,500 £35,000
25th Percentile £36,250 £35,000 £47,500
Median annual salary (50th Percentile) £56,250 £46,958 £70,000
Median % change year-on-year +19.79% -32.92% +3.70%
75th Percentile £76,250 £66,250 £72,500
90th Percentile £92,500 £90,000 £86,875
UK median annual salary £57,500 £46,958 £70,000
% change year-on-year +22.45% -32.92% +7.69%

All Process and Methodology Skills
England

Customer-Centricity falls under the Processes and Methodologies category. For comparison with the information above, the following table provides summary statistics for all permanent job vacancies requiring process or methodology skills in England.

Permanent vacancies with a requirement for process or methodology skills 45,955 78,409 78,695
As % of all permanent jobs advertised in England 93.36% 82.77% 95.44%
Number of salaries quoted 23,163 56,054 48,271
10th Percentile £28,750 £29,290 £34,308
25th Percentile £40,748 £40,000 £45,750
Median annual salary (50th Percentile) £57,500 £55,000 £62,500
Median % change year-on-year +4.55% -12.00% +4.17%
75th Percentile £75,000 £72,500 £82,500
90th Percentile £97,500 £92,500 £102,500
UK median annual salary £56,000 £55,000 £60,800
% change year-on-year +1.82% -9.54% +1.33%

Customer-Centricity
Job Vacancy Trend in England

Job postings citing Customer-Centricity as a proportion of all IT jobs advertised in England.
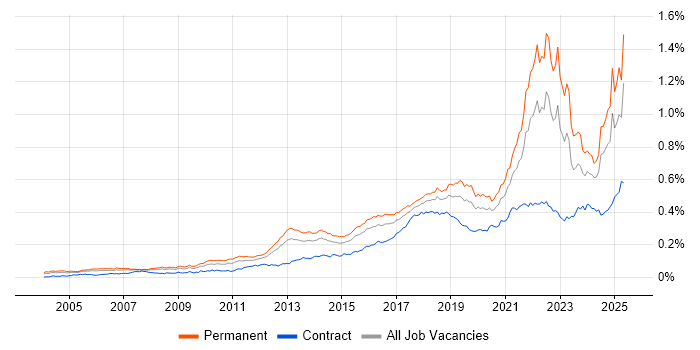
Job vacancy trend for Customer-Centricity in England

Customer-Centricity
Salary Trend in England

3-month moving average salary quoted in jobs citing Customer-Centricity in England.

Salary trend for Customer-Centricity in England

Customer-Centricity
Salary Histogram in England

Salary distribution for jobs citing Customer-Centricity in England over the 6 months to 11 June 2025.

Salary histogram for Customer-Centricity in England

Customer-Centricity
Job Locations in England

The table below looks at the demand and provides a guide to the median salaries quoted in IT jobs citing Customer-Centricity within the England region over the 6 months to 11 June 2025. The 'Rank Change' column provides an indication of the change in demand within each location based on the same 6 month period last year.

Location Rank Change
on Same Period
Last Year
Matching
Permanent
IT Job Ads
Median Salary
Past 6 Months
Median Salary
% Change
on Same Period
Last Year
Live
Jobs
London +99 194 £70,000 -3.45% 645
South East +79 150 £37,500 -11.76% 231
North of England +38 76 £35,000 -20.00% 182
North West +17 55 £24,500 -30.00% 119
Midlands +26 31 £45,000 +2.86% 80
West Midlands +46 21 £45,000 -29.27% 35
South West +53 20 £64,627 +37.63% 48
Yorkshire +40 18 £62,500 +13.64% 44
East of England +21 16 £90,000 +170.68% 53
East Midlands +21 10 £40,000 +35.59% 40
North East +49 3 £29,000 -22.67% 20
Customer-Centricity
UK

Customer-Centricity
Co-occurring Skills and Capabilities in England by Category

The follow tables expand on the table above by listing co-occurrences grouped by category. The same employment type, locality and period is covered with up to 20 co-occurrences shown in each of the following categories:

Application Platforms
1 81 (15.61%) Confluence
2 6 (1.16%) Microsoft Exchange
2 6 (1.16%) SharePoint
3 4 (0.77%) IIS
4 3 (0.58%) nginx
5 2 (0.39%) CICS
5 2 (0.39%) CMS
5 2 (0.39%) Headless CMS
6 1 (0.19%) Apache Spark
Applications
1 98 (18.88%) Microsoft Office
2 28 (5.39%) Microsoft Excel
3 6 (1.16%) Adobe Creative Suite
4 5 (0.96%) Adobe After Effects
4 5 (0.96%) Photoshop
5 3 (0.58%) Adobe Premiere
5 3 (0.58%) Microsoft PowerPoint
5 3 (0.58%) Microsoft Project
6 2 (0.39%) Adobe Illustrator
6 2 (0.39%) Chatbot
7 1 (0.19%) CINEMA 4D
7 1 (0.19%) InDesign
7 1 (0.19%) Sketch
7 1 (0.19%) Trello
Business Applications
1 10 (1.93%) Oracle Applications
1 10 (1.93%) Oracle EBS
2 4 (0.77%) Dynamics CRM
3 3 (0.58%) Salesforce CRM
4 2 (0.39%) SAP Oil and Gas
5 1 (0.19%) C-CURE
5 1 (0.19%) Dynamics NAV
5 1 (0.19%) SAP S/4HANA
Cloud Services
1 100 (19.27%) Azure
2 73 (14.07%) Asana
3 72 (13.87%) Miro
4 65 (12.52%) AWS
5 38 (7.32%) Microsoft 365
6 35 (6.74%) GCP
6 35 (6.74%) SaaS
7 21 (4.05%) Power Platform
7 21 (4.05%) Vertex AI
8 17 (3.28%) Azure Synapse Analytics
9 13 (2.50%) Azure Data Factory
10 11 (2.12%) GitHub
11 10 (1.93%) Figma
12 9 (1.73%) Azure DevOps
13 7 (1.35%) Cloud Computing
14 6 (1.16%) Azure AI
14 6 (1.16%) Azure Machine Learning
15 5 (0.96%) BlazeMeter
15 5 (0.96%) Dynamics 365
15 5 (0.96%) Google Analytics
Communications & Networking
1 75 (14.45%) Broadband
2 15 (2.89%) LAN
3 14 (2.70%) DNS
3 14 (2.70%) WAN
4 10 (1.93%) TCP/IP
5 8 (1.54%) Firewall
5 8 (1.54%) VLAN
6 7 (1.35%) DHCP
7 5 (0.96%) PBX
7 5 (0.96%) RTP
7 5 (0.96%) Softphone
7 5 (0.96%) VoIP
8 3 (0.58%) F5 BIG-IP LTM
8 3 (0.58%) HTTP
8 3 (0.58%) Network Security
8 3 (0.58%) Wireless
9 2 (0.39%) Internet
9 2 (0.39%) Remote Desktop
9 2 (0.39%) Reverse Proxy
9 2 (0.39%) VPN
Database & Business Intelligence
1 34 (6.55%) SQL Server
2 30 (5.78%) Data Mining
3 26 (5.01%) SQL Server Reporting Services
4 17 (3.28%) Power BI
5 11 (2.12%) DB2
6 10 (1.93%) SQL Server Integration Services
7 7 (1.35%) Data Warehouse
7 7 (1.35%) NoSQL
7 7 (1.35%) PostgreSQL
8 6 (1.16%) Relational Database
9 4 (0.77%) Azure SQL Database
9 4 (0.77%) MongoDB
10 3 (0.58%) Amazon RDS
10 3 (0.58%) Tableau
11 2 (0.39%) Elasticsearch
11 2 (0.39%) MySQL
11 2 (0.39%) SAP BW
12 1 (0.19%) Oracle Database
12 1 (0.19%) Oracle Exadata
12 1 (0.19%) Oracle Reports
Development Applications
1 97 (18.69%) JIRA
2 16 (3.08%) Jenkins
2 16 (3.08%) Visual Studio
3 15 (2.89%) Git
4 14 (2.70%) GitLab
5 6 (1.16%) Cucumber
5 6 (1.16%) Octopus Deploy
6 4 (0.77%) Selenium
7 3 (0.58%) Bitbucket
8 2 (0.39%) Android Studio
8 2 (0.39%) IntelliJ
8 2 (0.39%) JUnit
9 1 (0.19%) Artifactory
9 1 (0.19%) Cypress.io
9 1 (0.19%) SQL Server Management Studio (SSMS)
9 1 (0.19%) Subversion
9 1 (0.19%) TeamCity
9 1 (0.19%) Vite
9 1 (0.19%) webpack
General
1 237 (45.66%) Social Skills
2 205 (39.50%) Finance
3 115 (22.16%) Analytical Skills
4 91 (17.53%) Influencing Skills
5 75 (14.45%) Inclusion and Diversity
5 75 (14.45%) Retail
6 70 (13.49%) Law
7 51 (9.83%) Marketing
8 39 (7.51%) Banking
9 24 (4.62%) Legal
10 14 (2.70%) Pharmaceutical
10 14 (2.70%) Presentation Skills
11 13 (2.50%) Telecoms
12 11 (2.12%) Manufacturing
13 10 (1.93%) Organisational Skills
14 8 (1.54%) Games
14 8 (1.54%) Private Banking
14 8 (1.54%) Retail Banking
15 6 (1.16%) Advertising
15 6 (1.16%) Billing
Job Titles
1 118 (22.74%) Analyst
2 98 (18.88%) Lead
3 80 (15.41%) Senior
4 72 (13.87%) Product Analyst
5 38 (7.32%) Product Manager
6 31 (5.97%) Architect
7 29 (5.59%) Support Analyst
8 25 (4.82%) 1st Line Support
8 25 (4.82%) Developer
9 23 (4.43%) Applications Support
9 23 (4.43%) Support Engineer
10 21 (4.05%) Solutions Architect
11 20 (3.85%) IT Support
11 20 (3.85%) Senior Architect
11 20 (3.85%) Senior Solutions Architect
11 20 (3.85%) Software Engineer
12 16 (3.08%) IT Analyst
12 16 (3.08%) Portal Developer
13 15 (2.89%) IT Support Analyst
13 15 (2.89%) Team Leader
Libraries, Frameworks & Software Standards
1 33 (6.36%) .NET
2 26 (5.01%) React
3 21 (4.05%) JSON
4 17 (3.28%) .NET Framework
4 17 (3.28%) XML
5 16 (3.08%) .NET Core
6 11 (2.12%) Kafka
7 10 (1.93%) Middleware
7 10 (1.93%) Oracle Fusion
8 9 (1.73%) HTML
8 9 (1.73%) RESTful
8 9 (1.73%) Spring Boot
9 8 (1.54%) CSS
10 6 (1.16%) Spring
10 6 (1.16%) Web Services
11 5 (0.96%) ASP.NET
12 4 (0.77%) REST
12 4 (0.77%) SOAP
13 3 (0.58%) AngularJS
13 3 (0.58%) OAuth2
Miscellaneous
1 121 (23.31%) Product Ownership
2 78 (15.03%) Self-Motivation
3 72 (13.87%) Over-the-Top Content
3 72 (13.87%) Video\Live Streaming
4 32 (6.17%) Algorithms
5 18 (3.47%) Management Information System
5 18 (3.47%) Mobile App
6 17 (3.28%) FMCG
6 17 (3.28%) PMI
7 14 (2.70%) EPoS
8 13 (2.50%) Analytical Mindset
8 13 (2.50%) Hybrid Cloud
9 10 (1.93%) Wiki
10 9 (1.73%) Legacy Applications
10 9 (1.73%) Public Cloud
11 8 (1.54%) Cloud Native
11 8 (1.54%) Private Cloud
11 8 (1.54%) Social Media
12 6 (1.16%) Fixed Income
12 6 (1.16%) Virtual Team
Operating Systems
1 37 (7.13%) Windows
2 15 (2.89%) Linux
3 8 (1.54%) Windows Server
4 6 (1.16%) Android
4 6 (1.16%) Red Hat Enterprise Linux
4 6 (1.16%) Unix
5 5 (0.96%) CentOS
5 5 (0.96%) Rocky
5 5 (0.96%) Ubuntu
6 4 (0.77%) Apple iOS
7 2 (0.39%) Windows 10
7 2 (0.39%) zOS
Processes & Methodologies
1 234 (45.09%) Agile
2 189 (36.42%) Roadmaps
3 160 (30.83%) Problem-Solving
4 153 (29.48%) Product Management
5 139 (26.78%) Customer Service
6 113 (21.77%) CRM
6 113 (21.77%) Stakeholder Management
7 102 (19.65%) DevOps
8 94 (18.11%) Customer-Centric Approach
9 75 (14.45%) Analytics
10 72 (13.87%) Strategic Thinking
11 71 (13.68%) Artificial Intelligence
11 71 (13.68%) Continuous Improvement
12 58 (11.18%) Machine Learning
13 57 (10.98%) Coaching
14 55 (10.60%) Customer Experience
15 52 (10.02%) Incident Management
15 52 (10.02%) Project Management
16 49 (9.44%) Data Science
17 45 (8.67%) MLOps
Programming Languages
1 69 (13.29%) SQL
2 40 (7.71%) Python
3 33 (6.36%) Java
4 15 (2.89%) PL/SQL
5 12 (2.31%) C#
5 12 (2.31%) JavaScript
6 10 (1.93%) PowerShell
7 9 (1.73%) Bash
7 9 (1.73%) VB.NET
8 8 (1.54%) VBA
9 6 (1.16%) C++
9 6 (1.16%) TypeScript
10 5 (0.96%) R
10 5 (0.96%) Shell Script
10 5 (0.96%) VB
11 2 (0.39%) COBOL
11 2 (0.39%) Go
11 2 (0.39%) Kotlin
11 2 (0.39%) Swift
12 1 (0.19%) PHP
Qualifications
1 43 (8.29%) Degree
2 17 (3.28%) PMI Certification
3 10 (1.93%) Computer Science Degree
4 8 (1.54%) Master's Degree
4 8 (1.54%) Microsoft Certification
5 6 (1.16%) DBS Check
5 6 (1.16%) ITIL Certification
5 6 (1.16%) RHCSA
5 6 (1.16%) Six Sigma Green Belt
6 5 (0.96%) CISSP
6 5 (0.96%) GCIA
6 5 (0.96%) GCIH
6 5 (0.96%) OSCE
6 5 (0.96%) OSCP
6 5 (0.96%) Six Sigma Black Belt
7 4 (0.77%) CCNA
7 4 (0.77%) Cisco Certification
8 3 (0.58%) A+ Certification
8 3 (0.58%) CCNP
8 3 (0.58%) MCDST
Quality Assurance & Compliance
1 15 (2.89%) SLA
2 11 (2.12%) Accessibility
3 8 (1.54%) QA
4 6 (1.16%) Cyber Essentials
5 5 (0.96%) PMO
6 3 (0.58%) GDPR
6 3 (0.58%) GRC
6 3 (0.58%) NIST
7 2 (0.39%) IFRS
7 2 (0.39%) ISO/IEC 27001
8 1 (0.19%) Data Quality
8 1 (0.19%) ISO 14001
8 1 (0.19%) ISO 9001
8 1 (0.19%) SOC 1
8 1 (0.19%) SOC 2
8 1 (0.19%) WCAG
System Software
1 13 (2.50%) Active Directory
2 12 (2.31%) Docker
3 6 (1.16%) VMware Infrastructure
4 3 (0.58%) Hyper-V
4 3 (0.58%) Virtual Desktop
5 2 (0.39%) Virtual Machines
6 1 (0.19%) Firmware
Systems Management
1 20 (3.85%) Ansible
1 20 (3.85%) Kubernetes
1 20 (3.85%) Terraform
2 12 (2.31%) Microsoft Intune
3 10 (1.93%) Grafana
4 6 (1.16%) Nagios
5 5 (0.96%) CSIRT
5 5 (0.96%) FortiGate
5 5 (0.96%) Progress Chef
6 3 (0.58%) Prometheus
7 2 (0.39%) Argo
7 2 (0.39%) CA Endevor
7 2 (0.39%) Graylog
7 2 (0.39%) Single Sign-On
8 1 (0.19%) BMC PATROL
8 1 (0.19%) Oracle RMAN
8 1 (0.19%) RSA Archer
8 1 (0.19%) SCCM
Vendors
1 214 (41.23%) Microsoft
2 80 (15.41%) Salesforce
3 29 (5.59%) Cisco
4 26 (5.01%) Google
5 23 (4.43%) OpenAI
6 22 (4.24%) Oracle
7 18 (3.47%) Databricks
8 14 (2.70%) Fortinet
9 13 (2.50%) Aruba
9 13 (2.50%) Mellanox
9 13 (2.50%) NVIDIA
9 13 (2.50%) Palo Alto
10 12 (2.31%) ServiceNow
11 10 (1.93%) Dell
12 8 (1.54%) Splunk
12 8 (1.54%) VMware
13 7 (1.35%) Adobe
13 7 (1.35%) SolarWinds
14 6 (1.16%) Red Hat
14 6 (1.16%) SAP