Presentation Skills Job Trends in England

Presentation Skills
UK > England

The table below looks at the prevalence of the term Presentation Skills in permanent job vacancies in England. Included is a benchmarking guide to the salaries offered in vacancies that cited Presentation Skills over the 6 months leading up to 17 November 2025, comparing them to the same period in the previous two years.

6 months to
17 Nov 2025
Same period 2024 Same period 2023
Rank 160 130 174
Rank change year-on-year -30 +44 -53
Permanent jobs citing Presentation Skills 805 1,227 929
As % of all permanent jobs in England 1.77% 2.03% 1.97%
As % of the General category 2.76% 3.44% 3.03%
Number of salaries quoted 408 406 643
10th Percentile £32,500 £38,500 £36,250
25th Percentile £42,500 £46,250 £46,250
Median annual salary (50th Percentile) £57,500 £57,500 £60,249
Median % change year-on-year - -4.56% -7.31%
75th Percentile £84,375 £74,688 £78,750
90th Percentile £107,500 £97,500 £95,000
UK median annual salary £57,500 £60,000 £60,249
% change year-on-year -4.17% -0.41% -7.31%

All General Skills
England

Presentation Skills falls under the General Skills category. For comparison with the information above, the following table provides summary statistics for all permanent job vacancies requiring common skills in England.

Permanent vacancies with a requirement for common skills 29,163 35,672 30,698
As % of all permanent jobs advertised in England 64.13% 59.15% 64.97%
Number of salaries quoted 17,072 17,026 22,724
10th Percentile £28,000 £32,500 £31,250
25th Percentile £35,000 £43,750 £42,500
Median annual salary (50th Percentile) £52,500 £60,000 £60,000
Median % change year-on-year -12.50% - -
75th Percentile £75,000 £80,000 £82,500
90th Percentile £96,225 £101,250 £102,500
UK median annual salary £51,500 £60,000 £60,000
% change year-on-year -14.17% - -

Presentation Skills
Job Vacancy Trend in England

Historical trend showing the proportion of permanent IT job postings citing Presentation Skills relative to all permanent IT jobs advertised in England.
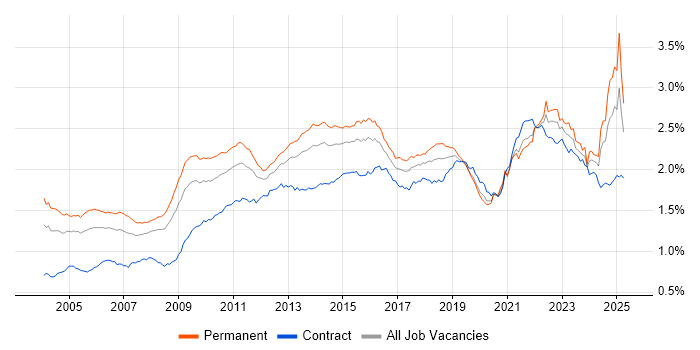
Presentation Skills job vacancy trend in England

Presentation Skills
Salary Trend in England

Salary distribution trend for jobs in England citing Presentation Skills.

Salary distribution trend for jobs in England citing Presentation Skills

Presentation Skills
Salary Histogram in England

Salary distribution for jobs citing Presentation Skills in England over the 6 months to 17 November 2025.

Salary histogram for Presentation Skills in England

Presentation Skills
Job Locations in England

The table below looks at the demand and provides a guide to the median salaries quoted in IT jobs citing Presentation Skills within the England region over the 6 months to 17 November 2025. The 'Rank Change' column provides an indication of the change in demand within each location based on the same 6 month period last year.

Location Rank Change
on Same Period
Last Year
Matching
Permanent
IT Job Ads
Median Salary
Past 6 Months
Median Salary
% Change
on Same Period
Last Year
Live
Jobs
London +47 402 £70,000 - 495
South East +9 134 £42,500 -24.45% 207
North of England -56 97 £47,500 +8.61% 123
Midlands -45 67 £62,500 +19.05% 77
South West -26 48 £43,750 -10.71% 60
West Midlands -30 48 £67,500 +25.00% 41
Yorkshire -35 47 £43,500 -22.67% 28
East of England +4 46 £37,500 -16.67% 61
North West -22 42 £47,500 +10.51% 80
East Midlands -30 19 £39,250 -7.65% 35
North East -3 9 £57,500 - 16
Presentation Skills
UK

Presentation Skills
Co-Occurring Skills & Capabilities in England by Category

The following tables expand on the one above by listing co-occurrences grouped by category. They cover the same employment type, locality and period, with up to 20 co-occurrences shown in each category:

Application Platforms
1 24 (2.98%) SharePoint
2 16 (1.99%) CMS
2 16 (1.99%) Confluence
3 10 (1.24%) SugarCRM
4 9 (1.12%) Microsoft Exchange
5 7 (0.87%) nginx
6 2 (0.25%) OpenStack
7 1 (0.12%) Apache Spark
7 1 (0.12%) Headless CMS
7 1 (0.12%) IIS
7 1 (0.12%) Moodle
7 1 (0.12%) Tomcat
7 1 (0.12%) WordPress
Applications
1 67 (8.32%) Microsoft Office
2 65 (8.07%) Microsoft Excel
3 35 (4.35%) Microsoft PowerPoint
4 23 (2.86%) Maya
5 7 (0.87%) Mozilla Thunderbird
6 6 (0.75%) MS Visio
7 5 (0.62%) Microsoft Project
8 3 (0.37%) Adobe Creative Suite
9 2 (0.25%) AutoCAD
9 2 (0.25%) Civil 3D
9 2 (0.25%) Revit
10 1 (0.12%) Photoshop
10 1 (0.12%) Trello
Business Applications
1 72 (8.94%) SAP S/4HANA
2 14 (1.74%) Dynamics CRM
3 12 (1.49%) SAP CO
3 12 (1.49%) SAP FI
3 12 (1.49%) SAP FI/CO
3 12 (1.49%) SAP IBP
4 11 (1.37%) SAP FSCM
4 11 (1.37%) SAP IS-U
5 5 (0.62%) Payment Gateway
6 2 (0.25%) CA PPM
6 2 (0.25%) IBM Planning Analytics
6 2 (0.25%) Oracle Cash Management
6 2 (0.25%) Oracle ERP
6 2 (0.25%) Oracle General Ledger
6 2 (0.25%) Oracle Payables
6 2 (0.25%) Oracle Receivables
6 2 (0.25%) SAP MM
6 2 (0.25%) SAP SCM
6 2 (0.25%) Teamcenter
6 2 (0.25%) Towers Watson Igloo
Cloud Services
1 106 (13.17%) Azure
2 82 (10.19%) Power Platform
3 65 (8.07%) Azure DevOps
4 52 (6.46%) SaaS
5 50 (6.21%) AWS
6 27 (3.35%) Microsoft 365
7 24 (2.98%) GCP
8 23 (2.86%) Amazon S3
8 23 (2.86%) Dynamics 365
9 21 (2.61%) Power Automate
10 18 (2.24%) Amazon EC2
10 18 (2.24%) Virtual Private Cloud
11 17 (2.11%) Entra ID
12 15 (1.86%) Amazon CloudWatch
12 15 (1.86%) Amazon ELB
12 15 (1.86%) AWS KMS
12 15 (1.86%) Azure Data Factory
12 15 (1.86%) PaaS
12 15 (1.86%) Slack
13 14 (1.74%) iPaaS
Communications & Networking
1 19 (2.36%) Firewall
2 14 (1.74%) DNS
3 13 (1.61%) FTP
3 13 (1.61%) HTTP
3 13 (1.61%) SMTP
3 13 (1.61%) SSH
3 13 (1.61%) WAN
4 12 (1.49%) Broadband
5 9 (1.12%) Wi-Fi
6 8 (0.99%) LAN
6 8 (0.99%) SD-WAN
7 7 (0.87%) IMAP
7 7 (0.87%) OpenLDAP
8 5 (0.62%) 5G
9 4 (0.50%) Ethernet
9 4 (0.50%) Intranet
9 4 (0.50%) VPN
10 3 (0.37%) MPLS
10 3 (0.37%) TCP/IP
10 3 (0.37%) Unified Communications
Database & Business Intelligence
1 65 (8.07%) Power BI
2 25 (3.11%) Data Lake
3 23 (2.86%) Tableau
4 17 (2.11%) Azure SQL Database
5 15 (1.86%) Amazon RDS
5 15 (1.86%) SQL Server
6 13 (1.61%) PostgreSQL
7 12 (1.49%) SAP BW
8 9 (1.12%) SQL Server Reporting Services
9 7 (0.87%) Amazon Aurora
10 6 (0.75%) Looker
11 5 (0.62%) Amazon Redshift
11 5 (0.62%) BigQuery
11 5 (0.62%) Data Warehouse
11 5 (0.62%) Relational Database
12 3 (0.37%) Amazon Athena
12 3 (0.37%) Big Data
12 3 (0.37%) Data Mining
12 3 (0.37%) Qlik Sense
13 2 (0.25%) MongoDB
Development Applications
1 102 (12.67%) JIRA
2 53 (6.58%) eCATT
3 22 (2.73%) NeoLoad
4 18 (2.24%) Jenkins
5 17 (2.11%) Git
6 14 (1.74%) Vagrant
7 5 (0.62%) Sonatype Nexus
8 2 (0.25%) Postman
8 2 (0.25%) Subversion
8 2 (0.25%) Visual Studio
9 1 (0.12%) GitLab
9 1 (0.12%) MagicDraw
9 1 (0.12%) MLflow
9 1 (0.12%) Pivotal Tracker
9 1 (0.12%) webpack
General
1 551 (68.45%) Social Skills
2 362 (44.97%) Finance
3 220 (27.33%) Marketing
4 194 (24.10%) Analytical Skills
5 95 (11.80%) Influencing Skills
6 77 (9.57%) Law
7 75 (9.32%) Inclusion and Diversity
8 74 (9.19%) Manufacturing
9 72 (8.94%) Legal
10 71 (8.82%) Retail
11 62 (7.70%) Organisational Skills
12 53 (6.58%) Public Sector
13 34 (4.22%) Telecoms
14 30 (3.73%) Games
15 28 (3.48%) Banking
16 22 (2.73%) Military
17 21 (2.61%) Local Government
18 20 (2.48%) Documentation Skills
19 19 (2.36%) Advertising
20 14 (1.74%) Financial Institution
Job Titles
1 146 (18.14%) Senior
2 98 (12.17%) Analyst
3 81 (10.06%) Architect
4 64 (7.95%) Business Manager
5 58 (7.20%) Consultant
5 58 (7.20%) Development Manager
6 55 (6.83%) Lead
7 54 (6.71%) Business Development Manager
8 52 (6.46%) Senior Manager
9 42 (5.22%) Solutions Architect
10 31 (3.85%) Sales Executive
11 28 (3.48%) Sales Manager
12 27 (3.35%) Account Manager
13 23 (2.86%) Business Analyst
13 23 (2.86%) Senior Business Development Manager
13 23 (2.86%) Senior Business Manager
13 23 (2.86%) Senior Development Manager
14 22 (2.73%) IT Architect
14 22 (2.73%) Test Analyst
15 20 (2.48%) Account Executive
Libraries, Frameworks & Software Standards
1 9 (1.12%) Middleware
2 7 (0.87%) LDAP
3 6 (0.75%) .NET
4 4 (0.50%) HTML
4 4 (0.50%) RESTful
5 3 (0.37%) CSS
5 3 (0.37%) Kafka
5 3 (0.37%) Node.js
5 3 (0.37%) React
5 3 (0.37%) REST
5 3 (0.37%) Web Services
6 2 (0.25%) .NET Framework
6 2 (0.25%) EDI
6 2 (0.25%) Elastic Stack
6 2 (0.25%) Mustache
6 2 (0.25%) SAP Fiori
6 2 (0.25%) Spring
6 2 (0.25%) Spring Boot
6 2 (0.25%) Unity (Game Engine)
6 2 (0.25%) WPF
Miscellaneous
1 109 (13.54%) Self-Motivation
2 80 (9.94%) Management Information System
3 46 (5.71%) Onboarding
4 43 (5.34%) Virtual Team
5 33 (4.10%) Driving Licence
6 32 (3.98%) Enterprise Software
7 29 (3.60%) Analytical Mindset
8 27 (3.35%) Algorithms
9 23 (2.86%) Social Media
10 19 (2.36%) Cloud Native
10 19 (2.36%) Data Centre
11 18 (2.24%) Product Ownership
12 15 (1.86%) Greenfield Project
13 14 (1.74%) NHS
13 14 (1.74%) Web Conferencing
14 12 (1.49%) Replication
15 9 (1.12%) Distributed Systems
16 8 (0.99%) Data Protection Act
16 8 (0.99%) Satnav
16 8 (0.99%) Security Posture
Operating Systems
1 33 (4.10%) Windows
2 26 (3.23%) Linux
3 14 (1.74%) VMS
4 11 (1.37%) Amazon Linux
5 7 (0.87%) Ubuntu
6 3 (0.37%) Windows Server
7 2 (0.25%) Android
8 1 (0.12%) Apple iOS
8 1 (0.12%) Unix
8 1 (0.12%) Windows Server 2016
Processes & Methodologies
1 169 (20.99%) Decision-Making
2 158 (19.63%) Problem-Solving
3 146 (18.14%) Agile
4 141 (17.52%) Business Development
5 140 (17.39%) Analytics
6 136 (16.89%) Risk Management
7 134 (16.65%) Project Management
8 131 (16.27%) Continuous Improvement
9 124 (15.40%) CRM
10 118 (14.66%) Roadmaps
11 108 (13.42%) ERP
12 86 (10.68%) Business Intelligence
13 85 (10.56%) Visualisation
14 82 (10.19%) Business Strategy
14 82 (10.19%) Stakeholder Management
15 79 (9.81%) AI
16 77 (9.57%) B2B
17 76 (9.44%) Stakeholder Engagement
18 71 (8.82%) Cybersecurity
19 69 (8.57%) Mentoring
Programming Languages
1 64 (7.95%) Python
2 54 (6.71%) SQL
3 28 (3.48%) PowerShell
4 22 (2.73%) Java
5 16 (1.99%) Bash
5 16 (1.99%) Go
6 14 (1.74%) Groovy
7 12 (1.49%) C#
8 8 (0.99%) MATLAB
9 7 (0.87%) Data Analysis Expressions
10 6 (0.75%) JavaScript
10 6 (0.75%) Perl
11 5 (0.62%) C++
12 4 (0.50%) R
13 3 (0.37%) C
13 3 (0.37%) Google Apps Script
13 3 (0.37%) Scala
13 3 (0.37%) Tcl
14 2 (0.25%) Ruby
15 1 (0.12%) VBA
Qualifications
1 266 (33.04%) Degree
2 57 (7.08%) Master's Degree
3 48 (5.96%) Security Cleared
4 36 (4.47%) SC Cleared
5 35 (4.35%) Computer Science Degree
6 27 (3.35%) ACCA
6 27 (3.35%) AWS Certification
7 24 (2.98%) CIMA
8 22 (2.73%) Azure Certification
9 19 (2.36%) CISSP
10 18 (2.24%) MBA
11 12 (1.49%) AWS Certified Solutions Architect
11 12 (1.49%) Microsoft Certification
12 11 (1.37%) Cisco Certification
12 11 (1.37%) CISM
12 11 (1.37%) HNC
13 10 (1.24%) BPSS Clearance
13 10 (1.24%) CISA
13 10 (1.24%) DV Cleared
13 10 (1.24%) PhD
Quality Assurance & Compliance
1 55 (6.83%) QA
2 37 (4.60%) ISO/IEC 27001
3 32 (3.98%) NIST
4 31 (3.85%) Accessibility
5 21 (2.61%) GDPR
6 14 (1.74%) Cyber Essentials
7 12 (1.49%) Data Quality
8 11 (1.37%) GRC
8 11 (1.37%) SLA
9 9 (1.12%) PMO
10 8 (0.99%) HMG Security Policy Framework
11 7 (0.87%) Actionable Recommendations
12 5 (0.62%) COBIT
13 4 (0.50%) Sarbanes-Oxley
14 3 (0.37%) Cyber Essentials PLUS
14 3 (0.37%) EU AI Act
14 3 (0.37%) IEC 61131
14 3 (0.37%) PCI DSS
15 2 (0.25%) ISO 19650
15 2 (0.25%) NCSC
System Software
1 17 (2.11%) Docker
2 15 (1.86%) Virtual Machines
3 12 (1.49%) DFS Replication
4 11 (1.37%) Active Directory
5 7 (0.87%) Dovecot
5 7 (0.87%) Postfix
5 7 (0.87%) Squid
6 3 (0.37%) VMware Infrastructure
7 2 (0.25%) VMware NSX
8 1 (0.12%) Hyper-V
8 1 (0.12%) Virtual Desktop
Systems Management
1 50 (6.21%) HP ALM
2 17 (2.11%) Terraform
3 13 (1.61%) Prometheus
4 12 (1.49%) Grafana
5 10 (1.24%) Microsoft Intune
6 8 (0.99%) Kubernetes
7 7 (0.87%) Nessus
7 7 (0.87%) Proxmox
8 3 (0.37%) Ansible
8 3 (0.37%) Nagios
9 2 (0.25%) Progress Chef
10 1 (0.12%) Active Directory Federation Services
10 1 (0.12%) Automic
10 1 (0.12%) Autotask
10 1 (0.12%) Kibana
10 1 (0.12%) OpenView
10 1 (0.12%) QRadar
10 1 (0.12%) SCCM
10 1 (0.12%) Single Sign-On
10 1 (0.12%) Tivoli
Vendors
1 148 (18.39%) Microsoft
2 101 (12.55%) SAP
3 54 (6.71%) Salesforce
4 51 (6.34%) HP
5 35 (4.35%) ServiceNow
6 29 (3.60%) Dell
7 26 (3.23%) Google
8 23 (2.86%) Oracle
9 19 (2.36%) Adobe
10 15 (1.86%) Tenable
11 12 (1.49%) MuleSoft
12 11 (1.37%) HubSpot
13 10 (1.24%) Broadcom
13 10 (1.24%) Databricks
14 8 (0.99%) Cisco
14 8 (0.99%) Software AG
15 7 (0.87%) Jaspersoft
16 6 (0.75%) Concur
16 6 (0.75%) Fortinet
17 5 (0.62%) Verint