Adobe Job Trends in England

Adobe
UK > England

The table below provides summary statistics for permanent job vacancies advertised in England requiring knowledge or experience of Adobe products and/or services. It includes a benchmarking guide to the annual salaries offered in vacancies that cited Adobe over the 6 months leading up to 5 November 2025, comparing them to the same period in the previous two years.

The figures below represent the IT labour market in general and are not representative of salaries within Adobe Systems, Inc.

6 months to
5 Nov 2025
Same period 2024 Same period 2023
Rank 107 362 338
Rank change year-on-year +255 -24 -69
Permanent jobs citing Adobe 1,173 421 421
As % of all permanent jobs in England 2.70% 0.69% 0.89%
As % of the Vendors category 6.31% 2.07% 2.13%
Number of salaries quoted 267 207 336
10th Percentile £26,500 £29,700 £27,375
25th Percentile £30,000 £35,200 £35,000
Median annual salary (50th Percentile) £42,500 £47,500 £50,000
Median % change year-on-year -10.53% -5.00% -
75th Percentile £54,250 £67,500 £68,750
90th Percentile £82,500 £90,000 £81,250
UK median annual salary £42,500 £47,500 £50,000
% change year-on-year -10.53% -5.00% -

All Vendors
England

Adobe falls under the Vendor Products and Services category. For comparison with the information above, the following table provides summary statistics for all permanent job vacancies requiring knowledge or experience of all vendor products and services in England.

Permanent vacancies with a requirement for knowledge or experience of vendor products and services 18,578 20,344 19,758
As % of all permanent jobs advertised in England 42.82% 33.46% 41.84%
Number of salaries quoted 10,265 10,505 15,236
10th Percentile £27,250 £31,250 £30,500
25th Percentile £33,125 £41,250 £41,250
Median annual salary (50th Percentile) £50,000 £57,500 £57,500
Median % change year-on-year -13.04% - +1.77%
75th Percentile £72,500 £77,500 £75,000
90th Percentile £90,000 £95,000 £92,500
UK median annual salary £50,000 £57,500 £55,000
% change year-on-year -13.04% +4.55% -3.51%

Adobe
Job Vacancy Trend in England

Historical trend showing the proportion of permanent IT job postings citing Adobe relative to all permanent IT jobs advertised in England.
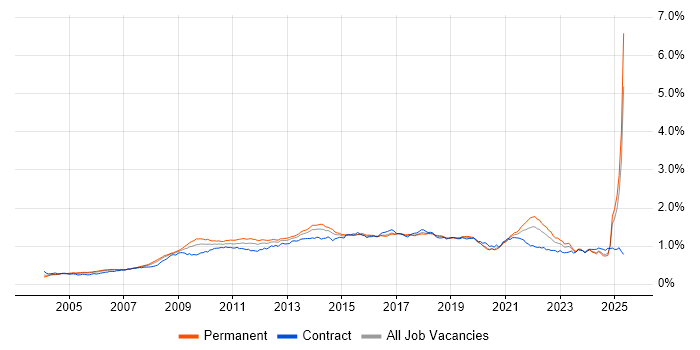
Adobe job vacancy trend in England

Adobe
Salary Trend in England

Salary distribution trend for jobs in England citing Adobe.

Salary distribution trend for jobs in England citing Adobe

Adobe
Salary Histogram in England

Salary distribution for jobs citing Adobe in England over the 6 months to 5 November 2025.

Salary histogram for Adobe in England

Adobe
Job Locations in England

The table below looks at the demand and provides a guide to the median salaries quoted in IT jobs citing Adobe within the England region over the 6 months to 5 November 2025. The 'Rank Change' column provides an indication of the change in demand within each location based on the same 6 month period last year.

Location Rank Change
on Same Period
Last Year
Matching
Permanent
IT Job Ads
Median Salary
Past 6 Months
Median Salary
% Change
on Same Period
Last Year
Live
Jobs
Midlands +177 334 £47,500 +24.18% 19
South East +212 316 £32,500 -23.53% 213
North of England +131 256 £35,000 -17.65% 41
London +75 205 £50,000 -21.57% 253
East Midlands +109 201 £80,000 +77.78% 8
Yorkshire +96 135 £32,250 -28.33% 12
West Midlands +123 131 £30,750 -12.14% 10
North West +70 104 £40,000 - 24
South West +37 24 £27,000 -32.50% 45
East of England +27 23 £37,500 +36.36% 16
North East +24 17 £55,000 +29.41% 5
Adobe
UK

Adobe
Co-Occurring Skills & Capabilities in England by Category

The following tables expand on the one above by listing co-occurrences grouped by category. They cover the same employment type, locality and period, with up to 20 co-occurrences shown in each category:

Application Platforms
1 26 (2.22%) WordPress
2 23 (1.96%) CMS
3 14 (1.19%) Confluence
4 13 (1.11%) SharePoint
5 6 (0.51%) Adobe Experience Manager
6 4 (0.34%) Drupal
7 3 (0.26%) IIS
8 2 (0.17%) Microsoft Exchange
9 1 (0.085%) Apache
9 1 (0.085%) Headless CMS
9 1 (0.085%) nginx
9 1 (0.085%) Sitecore CMS
9 1 (0.085%) Umbraco
Applications
1 118 (10.06%) Adobe Creative Suite
2 93 (7.93%) Photoshop
3 65 (5.54%) Adobe XD
4 63 (5.37%) Adobe Illustrator
5 55 (4.69%) Adobe Premiere
6 51 (4.35%) InDesign
6 51 (4.35%) Microsoft Office
7 42 (3.58%) Microsoft Excel
7 42 (3.58%) Microsoft PowerPoint
8 37 (3.15%) Sketch
9 31 (2.64%) Adobe After Effects
10 15 (1.28%) Maya
11 7 (0.60%) Final Cut Pro
12 6 (0.51%) Acrobat
12 6 (0.51%) Elementor
12 6 (0.51%) InVision
13 5 (0.43%) CINEMA 4D
13 5 (0.43%) SketchUp
13 5 (0.43%) Trello
14 4 (0.34%) Adobe Captivate
Business Applications
1 25 (2.13%) Dynamics CRM
2 13 (1.11%) Shopify
2 13 (1.11%) Sprinklr
3 12 (1.02%) Magento
4 11 (0.94%) Adobe Campaign
5 4 (0.34%) Q-Pulse
6 3 (0.26%) SAP CX
7 2 (0.17%) OpenCart
7 2 (0.17%) Oracle ERP
7 2 (0.17%) Oracle General Ledger
7 2 (0.17%) Oracle Payables
7 2 (0.17%) Oracle Receivables
8 1 (0.085%) Oracle CRM
Cloud Services
1 114 (9.72%) Figma
2 50 (4.26%) SaaS
3 44 (3.75%) Microsoft 365
4 31 (2.64%) Google Analytics
5 27 (2.30%) Adobe Analytics
6 25 (2.13%) Adobe Creative Cloud
7 24 (2.05%) Canva
8 19 (1.62%) Power Platform
8 19 (1.62%) Salesforce Commerce Cloud
9 18 (1.53%) AWS
9 18 (1.53%) Azure
10 14 (1.19%) Miro
11 13 (1.11%) Boomi
11 13 (1.11%) Google Ads
12 10 (0.85%) OneDrive
13 9 (0.77%) Entra ID
14 8 (0.68%) MailChimp
15 6 (0.51%) Dynamics 365
16 5 (0.43%) GCP
17 4 (0.34%) Cloudflare
Communications & Networking
1 11 (0.94%) DNS
2 9 (0.77%) Unified Communications
3 8 (0.68%) DHCP
4 6 (0.51%) TCP/IP
5 5 (0.43%) VPN
6 4 (0.34%) Firewall
6 4 (0.34%) LAN
6 4 (0.34%) Network Security
6 4 (0.34%) WAN
6 4 (0.34%) Wireless
7 3 (0.26%) Intranet
7 3 (0.26%) NAS
7 3 (0.26%) SAN
7 3 (0.26%) VLAN
8 1 (0.085%) Internet
8 1 (0.085%) SSH
8 1 (0.085%) VoIP
8 1 (0.085%) Wi-Fi
Database & Business Intelligence
1 19 (1.62%) Power BI
2 13 (1.11%) Data Lake
2 13 (1.11%) Tableau
3 6 (0.51%) MySQL
4 3 (0.26%) Mixpanel
5 2 (0.17%) SQL Server
6 1 (0.085%) Amazon RDS
6 1 (0.085%) BigQuery
6 1 (0.085%) Data Hub
6 1 (0.085%) Looker
Development Applications
1 22 (1.88%) JIRA
2 21 (1.79%) Axure RP
3 18 (1.53%) Balsamiq
4 10 (0.85%) Git
5 4 (0.34%) Maven
5 4 (0.34%) Selenium
6 3 (0.26%) Browser DevTools
6 3 (0.26%) Charles Proxy
6 3 (0.26%) Fiddler
6 3 (0.26%) Postman
6 3 (0.26%) TestNG
6 3 (0.26%) WebDriver
6 3 (0.26%) Zephyr
7 1 (0.085%) Bitbucket
7 1 (0.085%) JUnit
7 1 (0.085%) PhpStorm
7 1 (0.085%) PHPUnit
7 1 (0.085%) Storybook
7 1 (0.085%) WaveMaker
General
1 797 (67.95%) Retail
2 741 (63.17%) Manufacturing
3 210 (17.90%) Dutch Language
4 199 (16.97%) Marketing
5 196 (16.71%) Finnish Language
5 196 (16.71%) Norwegian Language
6 183 (15.60%) Social Skills
7 120 (10.23%) Analytical Skills
8 64 (5.46%) Inclusion and Diversity
9 49 (4.18%) Catalan Language
9 49 (4.18%) Organisational Skills
10 45 (3.84%) Law
11 42 (3.58%) Finance
12 31 (2.64%) Advertising
12 31 (2.64%) Public Sector
13 24 (2.05%) Multimedia
14 20 (1.71%) Presentation Skills
15 18 (1.53%) Banking
15 18 (1.53%) Influencing Skills
16 17 (1.45%) Games
Job Titles
1 738 (62.92%) Trainer
2 111 (9.46%) Designer
3 74 (6.31%) Senior
4 36 (3.07%) Architect
5 32 (2.73%) Marketing Executive
6 26 (2.22%) Graphic Designer
7 24 (2.05%) UX Designer
8 22 (1.88%) Developer
9 21 (1.79%) Lead
9 21 (1.79%) Senior Marketing Executive
10 20 (1.71%) Consultant
11 18 (1.53%) UI Designer
12 17 (1.45%) Marketing Manager
12 17 (1.45%) Strategy Manager
13 16 (1.36%) Junior
13 16 (1.36%) Senior Manager
14 15 (1.28%) IT Support
14 15 (1.28%) UI/UX Designer
15 14 (1.19%) CRM Architect
16 13 (1.11%) Salesforce Architect
Libraries, Frameworks & Software Standards
1 76 (6.48%) HTML
2 72 (6.14%) CSS
3 11 (0.94%) React
4 5 (0.43%) Bootstrap
4 5 (0.43%) Node.js
4 5 (0.43%) Sass
5 4 (0.34%) .NET
5 4 (0.34%) HTML5
5 4 (0.34%) Tailwind CSS
5 4 (0.34%) Vue
6 3 (0.26%) EDI
6 3 (0.26%) REST
7 2 (0.17%) ASP.NET
7 2 (0.17%) ASP.NET MVC
7 2 (0.17%) ASP.NET Web Forms
7 2 (0.17%) CSS3
7 2 (0.17%) jQuery
7 2 (0.17%) Oracle Fusion
7 2 (0.17%) Unreal Engine
7 2 (0.17%) Web Services
Miscellaneous
1 735 (62.66%) Robotics
2 101 (8.61%) Social Media
3 40 (3.41%) Graphic Design
4 35 (2.98%) Motion Graphics
5 34 (2.90%) Video Editing
6 30 (2.56%) Analytical Mindset
7 28 (2.39%) Onboarding
7 28 (2.39%) Product Ownership
8 24 (2.05%) Data Centre
9 23 (1.96%) Photography
10 22 (1.88%) Animation
10 22 (1.88%) Web Conferencing
11 20 (1.71%) Self-Motivation
12 19 (1.62%) Cloud Native
13 17 (1.45%) Blog
14 16 (1.36%) Digital Media
15 12 (1.02%) Enterprise Software
16 10 (0.85%) e-Learning
17 9 (0.77%) Mobile App
18 8 (0.68%) Learning Management System
Operating Systems
1 16 (1.36%) Windows
2 9 (0.77%) Android
2 9 (0.77%) Apple iOS
3 6 (0.51%) Linux
4 5 (0.43%) Windows 10
4 5 (0.43%) Windows Server
5 3 (0.26%) Mac OS
6 1 (0.085%) Windows Server 2008
6 1 (0.085%) Windows Server 2012
6 1 (0.085%) Windows Server 2016
6 1 (0.085%) Windows Server 2019
Processes & Methodologies
1 818 (69.74%) AI
2 814 (69.39%) Problem-Solving
3 747 (63.68%) Machine Learning
4 738 (62.92%) Generative AI
5 735 (62.66%) LLM
5 735 (62.66%) Red Team
6 544 (46.38%) Data Privacy
7 125 (10.66%) User Experience
8 116 (9.89%) Analytics
9 85 (7.25%) UX Design
10 82 (6.99%) Agile
10 82 (6.99%) CRM
11 69 (5.88%) Storytelling
12 66 (5.63%) Wireframes
13 65 (5.54%) Prototyping
14 61 (5.20%) Customer Experience
15 57 (4.86%) B2B
16 55 (4.69%) Digital Marketing
17 54 (4.60%) Project Management
18 52 (4.43%) Continuous Improvement
Programming Languages
1 60 (5.12%) JavaScript
2 17 (1.45%) SQL
3 11 (0.94%) PHP
4 8 (0.68%) Python
5 7 (0.60%) Java
6 4 (0.34%) C#
7 3 (0.26%) R
8 2 (0.17%) PowerShell
8 2 (0.17%) TypeScript
9 1 (0.085%) Bash
9 1 (0.085%) Ruby
Qualifications
1 888 (75.70%) Degree
2 27 (2.30%) Security Cleared
3 23 (1.96%) SC Cleared
4 13 (1.11%) Master's Degree
5 11 (0.94%) PMI Certification
5 11 (0.94%) PMP
6 7 (0.60%) ITIL Certification
7 5 (0.43%) Computer Science Degree
8 4 (0.34%) Microsoft Certification
9 3 (0.26%) BPSS Clearance
10 2 (0.17%) Azure Certification
11 1 (0.085%) A+ Certification
11 1 (0.085%) DBS Check
11 1 (0.085%) HNC
11 1 (0.085%) HND
11 1 (0.085%) NVQ Level 4
11 1 (0.085%) PhD
11 1 (0.085%) RIBA
Quality Assurance & Compliance
1 86 (7.33%) Accessibility
2 28 (2.39%) WCAG
3 17 (1.45%) ISO 9001
3 17 (1.45%) ISO/IEC 27001
4 16 (1.36%) QA
5 11 (0.94%) GDPR
6 6 (0.51%) Data Quality
7 3 (0.26%) Section 508
8 1 (0.085%) SLA
System Software
1 14 (1.19%) Active Directory
2 6 (0.51%) Docker
3 5 (0.43%) VMware Infrastructure
4 4 (0.34%) Firmware
4 4 (0.34%) Hyper-V
5 1 (0.085%) Terminal Server
5 1 (0.085%) Virtual Desktop
5 1 (0.085%) vSphere
5 1 (0.085%) XenDesktop
Systems Management
1 7 (0.60%) Terraform
2 5 (0.43%) Kubernetes
2 5 (0.43%) Microsoft Intune
3 2 (0.17%) Systems Management Server (SMS)
4 1 (0.085%) Jamf Pro
4 1 (0.085%) SCCM
4 1 (0.085%) Single Sign-On
Vendors
1 791 (67.43%) Google
2 735 (62.66%) Databricks
3 126 (10.74%) Microsoft
4 46 (3.92%) Salesforce
5 32 (2.73%) HubSpot
6 31 (2.64%) Apple
7 24 (2.05%) Dell
8 21 (1.79%) TikTok
9 19 (1.62%) Oracle
10 18 (1.53%) Facebook
10 18 (1.53%) Palo Alto
11 17 (1.45%) Instagram
11 17 (1.45%) Qualtrics
12 16 (1.36%) SAP
13 15 (1.28%) Cisco
13 15 (1.28%) MuleSoft
14 12 (1.02%) Zoho
15 7 (0.60%) Pardot
15 7 (0.60%) YouTube
16 6 (0.51%) NVIDIA