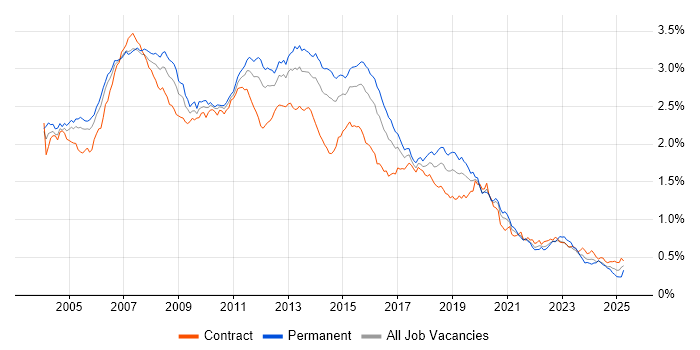
SQL Developer Contracts in London

SQL Developer
England > London

The median SQL Developer daily rate in London is £626, according to job vacancies posted in the 6 months leading up to 3 July 2025.

The table below provides contractor rate benchmarking and summary statistics, comparing them to the same period in the previous two years.

6 months to
3 Jul 2025
Same period 2024 Same period 2023
Rank 304 323 346
Rank change year-on-year +19 +23 +4
Contract jobs requiring a SQL Developer 56 84 142
As % of all contract jobs advertised in London 0.43% 0.48% 0.56%
As % of the Job Titles category 0.46% 0.51% 0.59%
Number of daily rates quoted 26 62 113
10th Percentile £313 £425 £400
25th Percentile £504 £500 £488
Median daily rate (50th Percentile) £626 £600 £550
Median % change year-on-year +4.38% +9.09% +4.76%
75th Percentile £750 £684 £650
90th Percentile £788 £838 £800
England median daily rate £475 £525 £525
% change year-on-year -9.52% - +5.00%

All Contract IT Job Vacancies
London

For comparison with the information above, the following table provides summary statistics for all contract IT job vacancies in London. Most job vacancies include a discernible job title that can be normalized. As such, the figures in the second row provide an indication of the number of contract jobs in our overall sample.

Contract vacancies in London with a recognized job title 12,238 16,553 23,993
% of contract IT jobs with a recognized job title 93.38% 93.92% 94.83%
Number of daily rates quoted 8,262 11,866 17,518
10th Percentile £332 £325 £363
25th Percentile £425 £444 £463
Median daily rate (50th Percentile) £550 £550 £575
Median % change year-on-year - -4.35% -
75th Percentile £675 £688 £700
90th Percentile £788 £800 £800
England median daily rate £513 £525 £550
% change year-on-year -2.38% -4.55% +1.85%
Number of hourly rates quoted 187 312 271
10th Percentile £18.87 £16.00 £18.00
25th Percentile £23.60 £20.24 £22.95
Median hourly rate £32.50 £27.81 £37.50
Median % change year-on-year +16.86% -25.84% +7.14%
75th Percentile £50.63 £46.49 £65.00
90th Percentile £64.25 £67.90 £82.50
England median hourly rate £28.18 £40.00 £43.93
% change year-on-year -29.55% -8.95% +75.72%

SQL Developer
Job Vacancy Trend in London

Job postings that featured SQL Developer in the job title as a proportion of all IT jobs advertised in London.

Job vacancy trend for SQL Developer in London

SQL Developer
Contractor Daily Rate Trend in London

3-month moving average daily rate quoted in jobs citing SQL Developer in London.

Daily rate trend for SQL Developer in London

SQL Developer
Daily Rate Histogram in London

Daily rate distribution for jobs citing SQL Developer in London over the 6 months to 3 July 2025.

Daily rate histogram for SQL Developer in London

SQL Developer
Contractor Hourly Rate Trend in London

3-month moving average hourly rates quoted in jobs citing SQL Developer in London.

Hourly rate trend for SQL Developer in London

SQL Developer
Contract Job Locations in London

The table below looks at the demand and provides a guide to the median contractor rates quoted in IT jobs citing SQL Developer within the London region over the 6 months to 3 July 2025. The 'Rank Change' column provides an indication of the change in demand within each location based on the same 6 month period last year.

Location Rank Change
on Same Period
Last Year
Matching
Contract
IT Job Ads
Median
Daily Rate
Past 6 Months
Median Daily Rate
% Change
on Same Period
Last Year
Live
Jobs
Central London +5 6 - - 7
SQL Developer
England

SQL Developer Skill Set
Top 30 Co-occurring Skills and Capabilities in London

For the 6 months to 3 July 2025, SQL Developer contract job roles required the following skills and capabilities in order of popularity. The figures indicate the absolute number co-occurrences and as a proportion of all contract job ads across the London region featuring SQL Developer in the job title.

1 55 (98.21%) SQL
2 33 (58.93%) Banking
3 32 (57.14%) Social Skills
4 31 (55.36%) Finance
5 24 (42.86%) Agile
6 23 (41.07%) Investment Banking
7 21 (37.50%) Python
8 20 (35.71%) Java
9 19 (33.93%) Problem-Solving
10 17 (30.36%) SQL Server
10 17 (30.36%) MongoDB
11 16 (28.57%) Kafka
11 16 (28.57%) Linux
11 16 (28.57%) Relational Database
11 16 (28.57%) Analytical Skills
12 15 (26.79%) Performance Tuning
12 15 (26.79%) Data Structures
12 15 (26.79%) Spring
13 14 (25.00%) Multithreading
13 14 (25.00%) Open Source
13 14 (25.00%) Database Tuning
13 14 (25.00%) Equities
13 14 (25.00%) Shell Script
13 14 (25.00%) JMS
13 14 (25.00%) Sybase
13 14 (25.00%) DB2
13 14 (25.00%) JUnit
13 14 (25.00%) SDLC
14 10 (17.86%) C#
14 10 (17.86%) Oracle

SQL Developer Skill Set
Co-occurring Skills and Capabilities in London by Category

The follow tables expand on the table above by listing co-occurrences grouped by category. The same employment type, locality and period is covered with up to 20 co-occurrences shown in each of the following categories:

Application Platforms
1 2 (3.57%) Apache
2 1 (1.79%) Apache Spark
2 1 (1.79%) Oracle Self-Service HR
Business Applications
1 3 (5.36%) Oracle Cash Management
1 3 (5.36%) Oracle EBS R12
1 3 (5.36%) Oracle Financials
1 3 (5.36%) Oracle General Ledger
1 3 (5.36%) Oracle Payables
1 3 (5.36%) Oracle Receivables
2 2 (3.57%) Dynamics CRM
3 1 (1.79%) Oracle EBS
3 1 (1.79%) Oracle Payroll
Cloud Services
1 8 (14.29%) Azure
2 5 (8.93%) Power Platform
3 4 (7.14%) Azure Data Factory
4 3 (5.36%) Microsoft 365
4 3 (5.36%) Microsoft Copilot
5 1 (1.79%) Azure AKS
5 1 (1.79%) Azure API Management
5 1 (1.79%) Azure DevOps
5 1 (1.79%) Azure Functions
5 1 (1.79%) Azure Logic Apps
5 1 (1.79%) Entra ID
5 1 (1.79%) NuGet
5 1 (1.79%) Serverless
Communications & Networking
1 1 (1.79%) HTTP
Database & Business Intelligence
1 17 (30.36%) MongoDB
1 17 (30.36%) SQL Server
2 16 (28.57%) Relational Database
3 14 (25.00%) DB2
4 8 (14.29%) SQL Server Integration Services
5 5 (8.93%) Power BI
5 5 (8.93%) Redis
6 4 (7.14%) Data Warehouse
6 4 (7.14%) NoSQL
6 4 (7.14%) Oracle BI Publisher
6 4 (7.14%) PostgreSQL
7 3 (5.36%) BusinessObjects
7 3 (5.36%) Crystal Reports
7 3 (5.36%) Oracle Reports
7 3 (5.36%) Tableau
8 2 (3.57%) Metadata
8 2 (3.57%) WebFOCUS
9 1 (1.79%) Apache Ignite
9 1 (1.79%) MySQL
9 1 (1.79%) SQL Server Reporting Services
Development Applications
1 14 (25.00%) JUnit
2 5 (8.93%) Octopus Deploy
3 3 (5.36%) Subversion
4 2 (3.57%) JIRA
5 1 (1.79%) Git
5 1 (1.79%) SQL Server Management Studio (SSMS)
5 1 (1.79%) tSQLt
General
1 33 (58.93%) Banking
2 32 (57.14%) Social Skills
3 31 (55.36%) Finance
4 23 (41.07%) Investment Banking
5 16 (28.57%) Analytical Skills
6 3 (5.36%) Corporate Banking
6 3 (5.36%) Documentation Skills
6 3 (5.36%) Retail
6 3 (5.36%) Retail Banking
7 2 (3.57%) Front Office
8 1 (1.79%) Digital Health
8 1 (1.79%) Digital Healthcare
8 1 (1.79%) Local Government
8 1 (1.79%) Public Sector
Libraries, Frameworks & Software Standards
1 16 (28.57%) Kafka
2 15 (26.79%) Spring
3 14 (25.00%) JMS
4 4 (7.14%) .NET
4 4 (7.14%) HTML
5 3 (5.36%) AngularJS
5 3 (5.36%) FastAPI
5 3 (5.36%) Flask
5 3 (5.36%) JSON
5 3 (5.36%) React
5 3 (5.36%) SQLAlchemy
6 2 (3.57%) Reactive Extensions
7 1 (1.79%) .NET Framework
7 1 (1.79%) CSS
7 1 (1.79%) Entity Framework
7 1 (1.79%) OAuth
7 1 (1.79%) RabbitMQ
7 1 (1.79%) RESTful
7 1 (1.79%) Sass
7 1 (1.79%) WCF
Miscellaneous
1 15 (26.79%) Data Structures
2 14 (25.00%) Equities
3 7 (12.50%) Hedge funds
3 7 (12.50%) Reference Data
4 5 (8.93%) Derivative
5 2 (3.57%) Enterprise Software
6 1 (1.79%) Clustering
6 1 (1.79%) Data Protection Act
6 1 (1.79%) NHS
6 1 (1.79%) Onboarding
Operating Systems
1 16 (28.57%) Linux
2 1 (1.79%) Unix
Processes & Methodologies
1 24 (42.86%) Agile
2 19 (33.93%) Problem-Solving
3 15 (26.79%) Performance Tuning
4 14 (25.00%) Database Tuning
4 14 (25.00%) Multithreading
4 14 (25.00%) Open Source
4 14 (25.00%) SDLC
5 9 (16.07%) Business Intelligence
6 8 (14.29%) Data Modelling
7 6 (10.71%) Data Analysis
7 6 (10.71%) ETL
7 6 (10.71%) Microservices
7 6 (10.71%) Unit Testing
8 5 (8.93%) Full-Stack Development
8 5 (8.93%) Software Engineering
8 5 (8.93%) SQL Optimisation
9 4 (7.14%) Migration
9 4 (7.14%) Requirements Gathering
9 4 (7.14%) User Acceptance Testing
10 3 (5.36%) Generative AI
Programming Languages
1 55 (98.21%) SQL
2 21 (37.50%) Python
3 20 (35.71%) Java
4 14 (25.00%) Shell Script
5 10 (17.86%) C#
6 4 (7.14%) PL/SQL
6 4 (7.14%) T-SQL
7 3 (5.36%) JavaScript
8 2 (3.57%) Ruby
8 2 (3.57%) TypeScript
9 1 (1.79%) Cypher
9 1 (1.79%) Data Analysis Expressions
9 1 (1.79%) Go
9 1 (1.79%) PHP
9 1 (1.79%) R
Qualifications
1 3 (5.36%) Computer Science Degree
1 3 (5.36%) Degree
Quality Assurance & Compliance
1 3 (5.36%) QA
2 2 (3.57%) Accessibility
2 2 (3.57%) Data Quality
3 1 (1.79%) HL7
Vendors
1 14 (25.00%) Sybase
2 10 (17.86%) Oracle
3 5 (8.93%) Microsoft
4 4 (7.14%) ServiceNow
5 1 (1.79%) IBM
5 1 (1.79%) RedGate
5 1 (1.79%) Splunk
5 1 (1.79%) Virgin Media