ServiceNow Contract Job Trends in London

ServiceNow
England > London

The table below provides summary statistics for contract job vacancies advertised in London requiring knowledge or experience of ServiceNow products and/or services. It includes a benchmarking guide to contractor rates offered in vacancies that cited ServiceNow over the 6 months leading up to 15 November 2025, comparing them to the same period in the previous two years.

The figures below represent the IT contractor job market in general and are not representative of contractor rates within ServiceNow.

6 months to
15 Nov 2025
Same period 2024 Same period 2023
Rank 98 67 84
Rank change year-on-year -31 +17 +63
Contract jobs citing ServiceNow 418 534 554
As % of all contract jobs in London 2.98% 3.40% 2.74%
As % of the Vendors category 6.40% 7.75% 6.65%
Number of daily rates quoted 274 287 394
10th Percentile £224 £243 £210
25th Percentile £325 £388 £413
Median daily rate (50th Percentile) £486 £520 £525
Median % change year-on-year -6.49% -0.95% -4.55%
75th Percentile £597 £575 £625
90th Percentile £688 £650 £688
England median daily rate £475 £500 £500
% change year-on-year -5.00% - -4.76%
Number of hourly rates quoted 5 1 6
10th Percentile - - £25.47
25th Percentile £25.00 £18.50 £36.81
Median hourly rate £25.15 £19.00 £52.50
Median % change year-on-year +32.37% -63.81% +169.23%
75th Percentile £27.25 £19.50 £53.75
90th Percentile £67.90 - £65.63
England median hourly rate £18.87 £21.78 £20.00
% change year-on-year -13.34% +8.88% +29.03%

All Vendors
London

ServiceNow falls under the Vendor Products and Services category. For comparison with the information above, the following table provides summary statistics for all contract job vacancies requiring knowledge or experience of all vendor products and services in London.

Contract vacancies with a requirement for knowledge or experience of vendor products and services 6,527 6,894 8,332
As % of all contract IT jobs advertised in London 46.53% 43.84% 41.20%
Number of daily rates quoted 4,215 4,341 5,797
10th Percentile £325 £313 £300
25th Percentile £420 £425 £428
Median daily rate (50th Percentile) £525 £538 £550
Median % change year-on-year -2.33% -2.27% -4.35%
75th Percentile £645 £638 £675
90th Percentile £738 £749 £775
England median daily rate £508 £525 £525
% change year-on-year -3.33% - -2.78%
Number of hourly rates quoted 137 65 120
10th Percentile £17.50 £20.80 £16.99
25th Percentile £22.50 £23.80 £22.38
Median hourly rate £25.15 £37.50 £40.25
Median % change year-on-year -32.93% -6.83% +59.41%
75th Percentile £38.75 £65.00 £60.00
90th Percentile £63.45 £97.00 £83.55
England median hourly rate £25.00 £35.00 £44.50
% change year-on-year -28.57% -21.35% +73.08%

ServiceNow
Job Vacancy Trend in London

Historical trend showing the proportion of contract IT job postings citing ServiceNow relative to all contract IT jobs advertised in London.
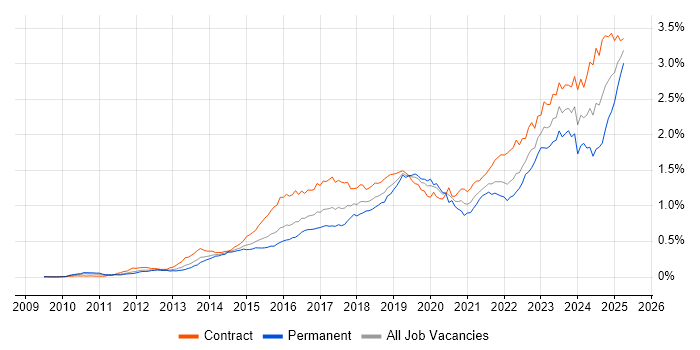
ServiceNow job vacancy trend in London

ServiceNow
Daily Rate Trend in London

Contractor daily rate distribution trend for jobs in London citing ServiceNow.

Contractor daily rate distribution trend for jobs in London citing ServiceNow

ServiceNow
Daily Rate Histogram in London

Daily rate distribution for jobs citing ServiceNow in London over the 6 months to 15 November 2025.

Daily rate histogram for ServiceNow in London

ServiceNow
Hourly Rate Trend in London

Contractor hourly rate distribution trend for jobs in London citing ServiceNow.

Contractor hourly rate distribution trend for jobs in London citing ServiceNow

ServiceNow
Hourly Rate Histogram in London

Hourly rate distribution of jobs citing ServiceNow in London over the 6 months to 15 November 2025.

Hourly rate histogram for ServiceNow in London

ServiceNow
Contract Job Locations in London

The table below looks at the demand and provides a guide to the median contractor rates quoted in IT jobs citing ServiceNow within the London region over the 6 months to 15 November 2025. The 'Rank Change' column provides an indication of the change in demand within each location based on the same 6 month period last year.

Location Rank Change
on Same Period
Last Year
Matching
Contract
IT Job Ads
Median
Daily Rate
Past 6 Months
Median Daily Rate
% Change
on Same Period
Last Year
Live
Jobs
Central London +3 53 £526 +5.10% 81
South London +8 18 £483 -3.45%
West London -5 12 £268 -18.32% 10
East London -4 2 £585 +8.33% 5
ServiceNow
England

ServiceNow
Co-Occurring Skills & Capabilities in London by Category

The following tables expand on the one above by listing co-occurrences grouped by category. They cover the same employment type, locality and period, with up to 20 co-occurrences shown in each category:

Application Platforms
1 46 (11.00%) Confluence
2 32 (7.66%) SharePoint
3 18 (4.31%) Microsoft Exchange
4 10 (2.39%) nginx
5 8 (1.91%) Oracle SOA Suite
6 4 (0.96%) Appian
6 4 (0.96%) Camunda
7 3 (0.72%) Apache
8 2 (0.48%) Apache Spark
8 2 (0.48%) IIS
8 2 (0.48%) SAS
9 1 (0.24%) Apache Airflow
9 1 (0.24%) Oracle Workflow
Applications
1 23 (5.50%) Microsoft Excel
2 21 (5.02%) Microsoft Office
3 13 (3.11%) MS Visio
4 12 (2.87%) Microsoft PowerPoint
5 10 (2.39%) Mozilla Thunderbird
6 9 (2.15%) Microsoft Project
7 4 (0.96%) Autodesk Inventor
7 4 (0.96%) Spreadsheet
8 3 (0.72%) Trello
9 1 (0.24%) Adobe Creative Suite
9 1 (0.24%) Chatbot
Business Applications
1 31 (7.42%) Remedy ITSM
2 6 (1.44%) Workday HCM
3 4 (0.96%) Dynamics CRM
3 4 (0.96%) Salesforce CRM
4 2 (0.48%) SAP Business One
5 1 (0.24%) Actimize
5 1 (0.24%) Cloudability
5 1 (0.24%) NetSuite
5 1 (0.24%) Oracle EBS
5 1 (0.24%) Oracle HRMS
5 1 (0.24%) Oracle Procure-to-Pay
5 1 (0.24%) Oracle Subledger Accounting
5 1 (0.24%) SAP GRC
5 1 (0.24%) SAP IBP
5 1 (0.24%) SAP S/4HANA
5 1 (0.24%) SAP SD
Cloud Services
1 93 (22.25%) Azure
2 80 (19.14%) Microsoft 365
3 68 (16.27%) AWS
4 30 (7.18%) Azure DevOps
5 28 (6.70%) Entra ID
6 26 (6.22%) Power Platform
7 20 (4.78%) SaaS
8 17 (4.07%) Amazon ECS
9 16 (3.83%) Amazon S3
9 16 (3.83%) Serverless
10 15 (3.59%) Amazon CloudWatch
11 14 (3.35%) Amazon EC2
12 12 (2.87%) AWS Lambda
13 11 (2.63%) Amazon ELB
13 11 (2.63%) GCP
13 11 (2.63%) GitHub
13 11 (2.63%) Virtual Private Cloud
14 10 (2.39%) AWS CloudFormation
14 10 (2.39%) OneDrive
14 10 (2.39%) Route 53
Communications & Networking
1 25 (5.98%) Firewall
2 24 (5.74%) DNS
3 21 (5.02%) VPN
4 16 (3.83%) SSL
5 12 (2.87%) SSH
6 11 (2.63%) HTTP
6 11 (2.63%) WAN
7 10 (2.39%) DHCP
7 10 (2.39%) FTP
7 10 (2.39%) IMAP
7 10 (2.39%) LAN
7 10 (2.39%) OpenLDAP
7 10 (2.39%) SMTP
7 10 (2.39%) TCP/IP
8 7 (1.67%) Network Security
8 7 (1.67%) Remote Desktop
9 6 (1.44%) Wireless
10 5 (1.20%) BGP
10 5 (1.20%) OSPF
10 5 (1.20%) SD-WAN
Database & Business Intelligence
1 21 (5.02%) Power BI
2 18 (4.31%) PostgreSQL
3 17 (4.07%) Amazon RDS
4 13 (3.11%) Amazon Aurora
5 8 (1.91%) DynamoDB
6 7 (1.67%) Oracle ODI
6 7 (1.67%) Tableau
7 5 (1.20%) Metadata
7 5 (1.20%) Relational Database
8 4 (0.96%) DB2
9 3 (0.72%) MongoDB
9 3 (0.72%) RDBMS
9 3 (0.72%) Redis
9 3 (0.72%) SQL Server Reporting Services
10 2 (0.48%) Data Lake
10 2 (0.48%) Data Warehouse
10 2 (0.48%) Oracle Reports
10 2 (0.48%) SQL Server Integration Services
11 1 (0.24%) Amazon Redshift
11 1 (0.24%) Looker
Development Applications
1 100 (23.92%) JIRA
2 20 (4.78%) Git
2 20 (4.78%) Jenkins
3 10 (2.39%) Vagrant
4 7 (1.67%) JUnit
5 5 (1.20%) Cucumber
5 5 (1.20%) Maven
6 4 (0.96%) GitLab
6 4 (0.96%) Metasploit
7 2 (0.48%) Burp Suite
7 2 (0.48%) Snyk
7 2 (0.48%) sqlmap
8 1 (0.24%) QADirector
8 1 (0.24%) Zephyr
General
1 158 (37.80%) Social Skills
2 102 (24.40%) Finance
3 56 (13.40%) Analytical Skills
4 45 (10.77%) Public Sector
5 27 (6.46%) Banking
6 20 (4.78%) Legal
6 20 (4.78%) Presentation Skills
7 17 (4.07%) Telecoms
8 12 (2.87%) Documentation Skills
9 7 (1.67%) Organisational Skills
10 6 (1.44%) Front Office
10 6 (1.44%) Law
11 5 (1.20%) Billing
11 5 (1.20%) Inclusion and Diversity
11 5 (1.20%) Military
12 4 (0.96%) Marketing
13 3 (0.72%) Pharmaceutical
14 2 (0.48%) Automotive
14 2 (0.48%) Financial Institution
14 2 (0.48%) Manufacturing
Job Titles
1 72 (17.22%) Architect
2 59 (14.11%) Developer
3 52 (12.44%) Analyst
4 44 (10.53%) ServiceNow Architect
5 42 (10.05%) ServiceNow Developer
6 35 (8.37%) Support Engineer
7 32 (7.66%) Consultant
8 25 (5.98%) Senior
9 23 (5.50%) Solutions Architect
10 22 (5.26%) Business Analyst
11 21 (5.02%) IT Support
12 19 (4.55%) Lead
13 15 (3.59%) IT Engineer
14 14 (3.35%) DevOps Engineer
14 14 (3.35%) Project Manager
15 13 (3.11%) AWS Engineer
15 13 (3.11%) Desktop Support
16 12 (2.87%) Platform Engineer
17 11 (2.63%) AWS DevOps
17 11 (2.63%) IT Support Engineer
Libraries, Frameworks & Software Standards
1 64 (15.31%) REST
2 51 (12.20%) SOAP
3 25 (5.98%) AngularJS
4 24 (5.74%) LDAP
5 23 (5.50%) Web Services
6 17 (4.07%) .NET
6 17 (4.07%) HTML
7 15 (3.59%) JSON
7 15 (3.59%) SAML
8 13 (3.11%) jQuery
9 12 (2.87%) Apache Camel
9 12 (2.87%) HTML5
9 12 (2.87%) JDBC
9 12 (2.87%) ODBC
9 12 (2.87%) RabbitMQ
10 10 (2.39%) React
11 9 (2.15%) Kafka
12 8 (1.91%) Oracle Fusion
13 7 (1.67%) Spring
14 6 (1.44%) OAuth
Miscellaneous
1 57 (13.64%) CMDB
2 22 (5.26%) Onboarding
3 15 (3.59%) Replication
3 15 (3.59%) Security Posture
4 9 (2.15%) Cloud Native
4 9 (2.15%) Data Centre
4 9 (2.15%) Product Ownership
5 8 (1.91%) Enterprise Software
6 7 (1.67%) Data Protection Act
6 7 (1.67%) Greenfield Project
6 7 (1.67%) Management Information System
7 4 (0.96%) Video Conferencing
8 3 (0.72%) Analytical Mindset
8 3 (0.72%) Cyber Threat
8 3 (0.72%) Life Science
8 3 (0.72%) Mobile App
8 3 (0.72%) Private Cloud
8 3 (0.72%) Self-Motivation
8 3 (0.72%) Virtual Team
9 2 (0.48%) Video\Live Streaming
Operating Systems
1 87 (20.81%) Windows
2 23 (5.50%) Linux
3 20 (4.78%) Windows 10
4 11 (2.63%) Apple iOS
4 11 (2.63%) Ubuntu
4 11 (2.63%) VMS
5 10 (2.39%) Amazon Linux
5 10 (2.39%) Unix
6 9 (2.15%) Android
6 9 (2.15%) Mac OS
7 4 (0.96%) Windows Server
8 1 (0.24%) CentOS
8 1 (0.24%) Mac OS X
8 1 (0.24%) Red Hat Enterprise Linux
8 1 (0.24%) Windows Server 2012
8 1 (0.24%) Windows Server 2016
8 1 (0.24%) Windows Server 2019
Processes & Methodologies
1 140 (33.49%) ITSM
2 112 (26.79%) Agile
3 83 (19.86%) Problem-Solving
4 82 (19.62%) ITIL
5 78 (18.66%) DevOps
6 55 (13.16%) Scrum
7 54 (12.92%) Service Management
8 49 (11.72%) Stakeholder Engagement
9 48 (11.48%) Stakeholder Management
10 47 (11.24%) CI/CD
11 43 (10.29%) Change Management
12 42 (10.05%) Customer Service
13 40 (9.57%) Analytics
14 37 (8.85%) Configuration Management
15 34 (8.13%) Risk Management
16 31 (7.42%) Security Operations
17 30 (7.18%) Cybersecurity
17 30 (7.18%) Migration
17 30 (7.18%) Roadmaps
18 29 (6.94%) Continuous Improvement
Programming Languages
1 64 (15.31%) Python
2 55 (13.16%) JavaScript
3 40 (9.57%) PowerShell
4 33 (7.89%) SQL
5 27 (6.46%) Java
6 21 (5.02%) TypeScript
7 18 (4.31%) Bash
8 13 (3.11%) Groovy
9 5 (1.20%) Kusto Query Language
10 4 (0.96%) Go
11 3 (0.72%) C#
12 2 (0.48%) Bicep
12 2 (0.48%) C
12 2 (0.48%) Perl
13 1 (0.24%) BeanShell
13 1 (0.24%) C++
13 1 (0.24%) PL/SQL
13 1 (0.24%) R
13 1 (0.24%) Ruby
13 1 (0.24%) Shell Script
Qualifications
1 92 (22.01%) Security Cleared
2 78 (18.66%) SC Cleared
3 47 (11.24%) Degree
4 12 (2.87%) AWS Certification
5 11 (2.63%) Azure Certification
6 9 (2.15%) BPSS Clearance
6 9 (2.15%) CISSP
7 7 (1.67%) ITIL Certification
8 6 (1.44%) CCNP
8 6 (1.44%) Cisco Certification
8 6 (1.44%) CISM
8 6 (1.44%) GPEN
8 6 (1.44%) OSCP
9 5 (1.20%) CIPD
9 5 (1.20%) Computer Science Degree
10 4 (0.96%) CEH
10 4 (0.96%) CISA
10 4 (0.96%) CompTIA Security+
10 4 (0.96%) DV Cleared
10 4 (0.96%) Microsoft Certification
Quality Assurance & Compliance
1 22 (5.26%) QA
2 20 (4.78%) GDPR
3 14 (3.35%) GRC
3 14 (3.35%) NIST
3 14 (3.35%) SLA
4 13 (3.11%) ISO/IEC 27001
5 8 (1.91%) Data Quality
5 8 (1.91%) PMO
6 7 (1.67%) Accessibility
6 7 (1.67%) COBIT
6 7 (1.67%) PCI DSS
6 7 (1.67%) Sarbanes-Oxley
7 4 (0.96%) HIPAA
8 3 (0.72%) ISO/IEC 19770
8 3 (0.72%) WCAG
9 2 (0.48%) California Consumer Privacy Act
9 2 (0.48%) FIPS 140-2
10 1 (0.24%) Actionable Recommendations
10 1 (0.24%) FISMA
10 1 (0.24%) ISO 22301
System Software
1 55 (13.16%) Active Directory
2 24 (5.74%) Docker
3 10 (2.39%) DFS Replication
3 10 (2.39%) Dovecot
3 10 (2.39%) Postfix
3 10 (2.39%) Squid
4 2 (0.48%) BitLocker
4 2 (0.48%) Firmware
4 2 (0.48%) Virtual Desktop
4 2 (0.48%) VMware Infrastructure
5 1 (0.24%) Hyper-V
5 1 (0.24%) RACF
5 1 (0.24%) Virtual Machines
5 1 (0.24%) VMware ESXi
5 1 (0.24%) vSphere
Systems Management
1 24 (5.74%) Terraform
2 20 (4.78%) Microsoft Intune
3 19 (4.55%) Single Sign-On
4 15 (3.59%) Grafana
4 15 (3.59%) Nessus
5 13 (3.11%) Prometheus
5 13 (3.11%) SCCM
6 11 (2.63%) Ansible
7 10 (2.39%) Proxmox
8 8 (1.91%) Jamf Pro
9 7 (1.67%) RSA Archer
10 6 (1.44%) Kubernetes
11 3 (0.72%) Rancher
12 2 (0.48%) Nmap
12 2 (0.48%) QRadar
13 1 (0.24%) Cisco UCCE
13 1 (0.24%) FortiGate
13 1 (0.24%) HP Operations Orchestration
13 1 (0.24%) ITRS Geneos
13 1 (0.24%) WSUS
Vendors
1 89 (21.29%) Microsoft
2 42 (10.05%) Remedy
3 22 (5.26%) Cisco
3 22 (5.26%) Oracle
4 21 (5.02%) Salesforce
5 19 (4.55%) SAP
6 15 (3.59%) BMC
6 15 (3.59%) HP
7 13 (3.11%) Workday
8 12 (2.87%) Ivanti
9 11 (2.63%) Splunk
10 10 (2.39%) Jaspersoft
11 9 (2.15%) Apple
11 9 (2.15%) CrowdStrike
11 9 (2.15%) Okta
11 9 (2.15%) Tenable
12 7 (1.67%) Bloomberg
12 7 (1.67%) CA Agile Central
12 7 (1.67%) Databricks
13 6 (1.44%) Rapid7