Performance Tuning Contracts in London

Performance Tuning
England > London

The following table provides summary statistics for contract job vacancies advertised in London with a requirement for Performance Tuning skills. Included is a benchmarking guide to the contractor rates offered in vacancies that have cited Performance Tuning over the 6 months to 11 May 2024 with a comparison to the same period in the previous 2 years.

6 months to
11 May 2024
Same period 2023 Same period 2022
Rank 264 252 263
Rank change year-on-year -12 +11 -88
Contract jobs citing Performance Tuning 130 265 394
As % of all contract jobs advertised in London 0.74% 1.01% 1.02%
As % of the Processes & Methodologies category 0.83% 1.11% 1.11%
Number of daily rates quoted 82 158 263
10th Percentile £375 £413 £463
25th Percentile £425 £463 £550
Median daily rate (50th Percentile) £525 £575 £700
Median % change year-on-year -8.70% -17.86% +27.27%
75th Percentile £700 £747 £850
90th Percentile £838 £800 £913
England median daily rate £510 £525 £591
% change year-on-year -2.86% -11.21% +12.62%
Number of hourly rates quoted 1 0 4
10th Percentile - - £26.38
25th Percentile £46.75 - £35.94
Median hourly rate £48.50 - £42.02
75th Percentile £50.25 - £42.45
90th Percentile - - £43.23
England median hourly rate £61.60 £72.50 £46.25
% change year-on-year -15.03% +56.76% -29.39%

All Process and Methodology Skills
London

Performance Tuning is in the Processes and Methodologies category. The following table is for comparison with the above and provides summary statistics for all contract job vacancies advertised in London with a requirement for process or methodology skills.

Contract vacancies with a requirement for process or methodology skills 15,657 23,832 35,541
As % of all contract IT jobs advertised in London 88.72% 90.97% 92.31%
Number of daily rates quoted 11,214 17,166 25,985
10th Percentile £341 £375 £388
25th Percentile £450 £475 £475
Median daily rate (50th Percentile) £550 £590 £575
Median % change year-on-year -6.78% +2.61% +9.52%
75th Percentile £681 £700 £688
90th Percentile £800 £800 £775
England median daily rate £525 £550 £538
% change year-on-year -4.55% +2.33% +7.50%
Number of hourly rates quoted 313 270 416
10th Percentile £15.96 £18.45 £17.40
25th Percentile £20.00 £22.53 £23.91
Median hourly rate £28.00 £38.25 £36.75
Median % change year-on-year -26.80% +4.08% +13.08%
75th Percentile £48.75 £63.94 £51.00
90th Percentile £66.40 £80.23 £69.06
England median hourly rate £37.18 £37.50 £25.00
% change year-on-year -0.85% +50.00% +6.38%

Performance Tuning
Job Vacancy Trend in London

Job postings citing Performance Tuning as a proportion of all IT jobs advertised in London.
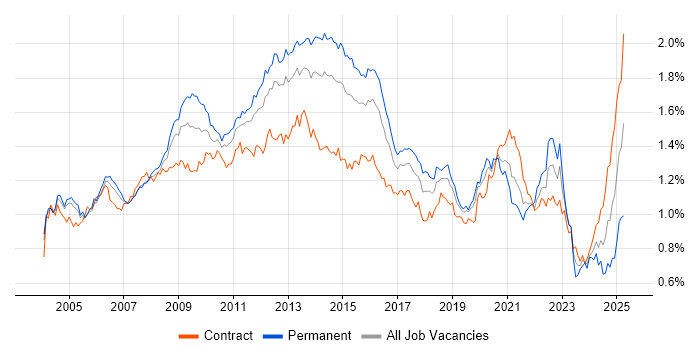
Job vacancy trend for Performance Tuning in London

Performance Tuning
Contractor Daily Rate Trend in London

3-month moving average daily rate quoted in jobs citing Performance Tuning in London.

Daily rate trend for Performance Tuning in London

Performance Tuning
Daily Rate Histogram in London

Daily rate distribution for jobs citing Performance Tuning in London over the 6 months to 11 May 2024.

Daily rate histogram for Performance Tuning in London

Performance Tuning
Contractor Hourly Rate Trend in London

3-month moving average hourly rates quoted in jobs citing Performance Tuning in London.

Hourly rate trend for Performance Tuning in London

Performance Tuning
Contract Job Locations in London

The table below looks at the demand and provides a guide to the median contractor rates quoted in IT jobs citing Performance Tuning within the London region over the 6 months to 11 May 2024. The 'Rank Change' column provides an indication of the change in demand within each location based on the same 6 month period last year.

Location Rank Change
on Same Period
Last Year
Matching
Contract
IT Job Ads
Median
Daily Rate
Past 6 Months
Median Daily Rate
% Change
on Same Period
Last Year
Live
Jobs
Central London +15 4 £525 -18.60% 2
East London -1 1 £450 +121.16%
Performance Tuning
England

Performance Tuning
Co-occurring Skills and Capabilities in London by Category

The follow tables expand on the table above by listing co-occurrences grouped by category. The same employment type, locality and period is covered with up to 20 co-occurrences shown in each of the following categories:

Application Platforms
1 9 (6.92%) Apache Spark
2 8 (6.15%) Confluence
3 5 (3.85%) Anypoint
3 5 (3.85%) Mule
3 5 (3.85%) Mule ESB
3 5 (3.85%) OpenStack
4 4 (3.08%) Microsoft Exchange
5 3 (2.31%) Apache
5 3 (2.31%) Apache Airflow
5 3 (2.31%) ArcGIS
6 2 (1.54%) CICS
6 2 (1.54%) NetWeaver
6 2 (1.54%) nginx
6 2 (1.54%) Oracle Workflow
7 1 (0.77%) GemFire
7 1 (0.77%) Oracle Coherence
7 1 (0.77%) Oracle HTTP Server
7 1 (0.77%) Oracle SOA Suite
7 1 (0.77%) SharePoint
7 1 (0.77%) WebLogic
Business Applications
1 5 (3.85%) Dynamics CRM
2 4 (3.08%) SAP S/4HANA
3 2 (1.54%) ION Anvil
3 2 (1.54%) ION MarketView
3 2 (1.54%) Oracle EBS
3 2 (1.54%) SAP IBP
4 1 (0.77%) BusinessWorks
4 1 (0.77%) SAP HCM
4 1 (0.77%) SAP Payroll
Cloud Services
1 43 (33.08%) Azure
2 42 (32.31%) AWS
3 14 (10.77%) PaaS
4 13 (10.00%) GCP
4 13 (10.00%) IaaS
5 11 (8.46%) Amazon S3
6 10 (7.69%) Amazon EC2
7 9 (6.92%) Cloud Computing
8 8 (6.15%) Nutanix
8 8 (6.15%) Power Platform
8 8 (6.15%) Rubrik
8 8 (6.15%) SaaS
9 7 (5.38%) Azure Data Factory
9 7 (5.38%) Serverless
10 6 (4.62%) Dynamics 365
10 6 (4.62%) WhatsApp
11 5 (3.85%) Azure Logic Apps
11 5 (3.85%) GitHub
11 5 (3.85%) OpenShift
12 4 (3.08%) AWS Lambda
Communications & Networking
1 12 (9.23%) Firewall
2 9 (6.92%) DHCP
2 9 (6.92%) Kerberos
2 9 (6.92%) SAN
2 9 (6.92%) TCP/IP
2 9 (6.92%) VLAN
3 8 (6.15%) DNS
3 8 (6.15%) NAS
4 2 (1.54%) AMQP
4 2 (1.54%) SSH
4 2 (1.54%) WAN
5 1 (0.77%) Fibre Channel
5 1 (0.77%) HTTP
5 1 (0.77%) InfiniBand
5 1 (0.77%) iSCSI
5 1 (0.77%) LAN
5 1 (0.77%) Network Security
5 1 (0.77%) SD-WAN
5 1 (0.77%) Spanning Tree
Database & Business Intelligence
1 32 (24.62%) SQL Server
2 20 (15.38%) PostgreSQL
3 16 (12.31%) Data Warehouse
4 12 (9.23%) NoSQL
5 11 (8.46%) Amazon RDS
5 11 (8.46%) MySQL
6 10 (7.69%) Relational Database
7 9 (6.92%) SQL Server Integration Services
8 7 (5.38%) Oracle Database
9 6 (4.62%) Azure SQL Database
9 6 (4.62%) MongoDB
9 6 (4.62%) SAP HANA
10 5 (3.85%) Amazon Aurora
10 5 (3.85%) Data Lake
10 5 (3.85%) DB2
10 5 (3.85%) Oracle Exadata
10 5 (3.85%) SQL Server Analysis Services
10 5 (3.85%) SQL Server Reporting Services
11 4 (3.08%) Amazon Redshift
11 4 (3.08%) Oracle Reports
Development Applications
1 19 (14.62%) Jenkins
2 18 (13.85%) Git
3 8 (6.15%) JIRA
3 8 (6.15%) TeamCity
3 8 (6.15%) Visual Studio
4 5 (3.85%) MSI
4 5 (3.85%) SQL Server Management Studio (SSMS)
4 5 (3.85%) WiX
5 4 (3.08%) JUnit
5 4 (3.08%) Mockito
6 3 (2.31%) GitLab
7 2 (1.54%) Cypress.io
7 2 (1.54%) Mocha
General
1 42 (32.31%) Finance
2 40 (30.77%) Social Skills
3 15 (11.54%) Analytical Skills
4 9 (6.92%) Banking
4 9 (6.92%) Public Sector
5 5 (3.85%) Investment Banking
6 3 (2.31%) Financial Institution
6 3 (2.31%) Front Office
6 3 (2.31%) Telecoms
7 2 (1.54%) Electronics
7 2 (1.54%) Manufacturing
7 2 (1.54%) Marketing
7 2 (1.54%) Organisational Skills
7 2 (1.54%) Presentation Skills
8 1 (0.77%) Arabic Language
8 1 (0.77%) French Language
8 1 (0.77%) German Language
8 1 (0.77%) Japanese Language
8 1 (0.77%) Korean Language
8 1 (0.77%) Spanish Language
Job Titles
1 35 (26.92%) Developer
2 24 (18.46%) DBA
3 14 (10.77%) SQL DBA
4 13 (10.00%) Senior
5 11 (8.46%) Administrator
6 9 (6.92%) Architect
7 8 (6.15%) Oracle Developer
7 8 (6.15%) Scala Developer
7 8 (6.15%) Software Engineer
8 7 (5.38%) DV Cleared DBA
8 7 (5.38%) Lead
9 6 (4.62%) AWS Developer
9 6 (4.62%) Java Developer
9 6 (4.62%) SQL Server DBA
10 5 (3.85%) AWS Administrator
10 5 (3.85%) Data Engineer
10 5 (3.85%) MuleSoft Developer
10 5 (3.85%) Senior Developer
10 5 (3.85%) Senior Java Developer
10 5 (3.85%) Solutions Architect
Libraries, Frameworks & Software Standards
1 17 (13.08%) .NET
2 13 (10.00%) REST
3 10 (7.69%) Entity Framework
4 9 (6.92%) JSON
4 9 (6.92%) Kafka
4 9 (6.92%) LDAP
5 7 (5.38%) .NET Framework
5 7 (5.38%) SOAP
5 7 (5.38%) XML
6 6 (4.62%) ASP.NET
6 6 (4.62%) Web Services
6 6 (4.62%) XSLT
7 5 (3.85%) ASP.NET Web API
7 5 (3.85%) LINQ
7 5 (3.85%) Microsoft Enterprise Library
7 5 (3.85%) NHibernate
7 5 (3.85%) Spring Boot
7 5 (3.85%) WCF
8 4 (3.08%) RabbitMQ
8 4 (3.08%) Spring
Miscellaneous
1 15 (11.54%) Clustering
1 15 (11.54%) Replication
2 9 (6.92%) Data Centre
2 9 (6.92%) Fixed Income
3 7 (5.38%) Derivative
4 5 (3.85%) Client/Server
4 5 (3.85%) Market Risk
4 5 (3.85%) Web 2.0
5 4 (3.08%) Credit Derivative
5 4 (3.08%) Onboarding
5 4 (3.08%) Product Ownership
5 4 (3.08%) Public Cloud
6 3 (2.31%) Equities
6 3 (2.31%) Foreign Exchange (FX)
6 3 (2.31%) Management Information System
7 2 (1.54%) Algorithms
7 2 (1.54%) Data Protection Act
7 2 (1.54%) LPAR
7 2 (1.54%) Mainframe
7 2 (1.54%) NHS
Operating Systems
1 28 (21.54%) Linux
2 16 (12.31%) Windows
3 14 (10.77%) Unix
4 11 (8.46%) Red Hat Enterprise Linux
5 8 (6.15%) Oracle Linux
5 8 (6.15%) Solaris
5 8 (6.15%) Windows Server
6 4 (3.08%) zOS
7 1 (0.77%) CentOS
Processes & Methodologies
1 35 (26.92%) DevOps
2 34 (26.15%) Agile
3 31 (23.85%) Problem-Solving
4 30 (23.08%) Migration
5 27 (20.77%) CI/CD
6 22 (16.92%) Data Integration
7 20 (15.38%) Disaster Recovery
7 20 (15.38%) Infrastructure as Code
8 18 (13.85%) Continuous Integration
8 18 (13.85%) High Availability
9 15 (11.54%) Software Engineering
10 14 (10.77%) Computer Science
10 14 (10.77%) Storage Management
11 13 (10.00%) Continuous Improvement
11 13 (10.00%) Data Security
11 13 (10.00%) ETL
12 12 (9.23%) Deployment Automation
13 11 (8.46%) Containerisation
13 11 (8.46%) Database Security
13 11 (8.46%) Database Tuning
Programming Languages
1 68 (52.31%) SQL
2 33 (25.38%) Python
3 22 (16.92%) Bash
4 17 (13.08%) JavaScript
5 16 (12.31%) C#
6 14 (10.77%) Java
6 14 (10.77%) PowerShell
7 8 (6.15%) PL/SQL
7 8 (6.15%) Scala
7 8 (6.15%) T-SQL
8 2 (1.54%) COBOL
8 2 (1.54%) Kotlin
8 2 (1.54%) Perl
8 2 (1.54%) REXX
8 2 (1.54%) TypeScript
8 2 (1.54%) VB.NET
8 2 (1.54%) VBA
9 1 (0.77%) Bicep
9 1 (0.77%) Go
9 1 (0.77%) R
Qualifications
1 24 (18.46%) Degree
2 20 (15.38%) Security Cleared
3 13 (10.00%) Computer Science Degree
3 13 (10.00%) DV Cleared
4 8 (6.15%) SC Cleared
5 6 (4.62%) Master's Degree
6 4 (3.08%) Azure Certification
6 4 (3.08%) Microsoft Certification
7 3 (2.31%) MCITP
7 3 (2.31%) MCTS
8 2 (1.54%) AWS Certification
9 1 (0.77%) PhD
9 1 (0.77%) SAP Certification
Quality Assurance & Compliance
1 10 (7.69%) GDPR
2 8 (6.15%) Sarbanes-Oxley
3 5 (3.85%) QA
4 4 (3.08%) Accessibility
4 4 (3.08%) Data Quality
5 2 (1.54%) Cyber Essentials
5 2 (1.54%) ISO/IEC 27001
6 1 (0.77%) HIPAA
System Software
1 26 (20.00%) Docker
2 12 (9.23%) VMware Infrastructure
3 9 (6.92%) Active Directory
4 8 (6.15%) Firmware
5 7 (5.38%) Virtual Machines
6 1 (0.77%) Ceph
6 1 (0.77%) GridGain
6 1 (0.77%) iptables
6 1 (0.77%) KVM
6 1 (0.77%) Lustre
6 1 (0.77%) NFS
6 1 (0.77%) Samba
6 1 (0.77%) Slurm Workload Manager
6 1 (0.77%) vSphere
Systems Management
1 27 (20.77%) Kubernetes
2 23 (17.69%) Terraform
3 17 (13.08%) Ansible
4 8 (6.15%) EMC NetWorker
4 8 (6.15%) Netcool
4 8 (6.15%) Tivoli
4 8 (6.15%) Tivoli Storage Manager
5 6 (4.62%) Oracle Enterprise Manager
5 6 (4.62%) Puppet
6 5 (3.85%) CloudHub
6 5 (3.85%) Dell DRAC
6 5 (3.85%) Progress Chef
7 2 (1.54%) Grafana
7 2 (1.54%) Prometheus
8 1 (0.77%) Data Guard
8 1 (0.77%) FortiGate
8 1 (0.77%) HAProxy
8 1 (0.77%) Oracle Flashback
8 1 (0.77%) SELinux
8 1 (0.77%) yum
Vendors
1 38 (29.23%) Oracle
2 33 (25.38%) Microsoft
3 13 (10.00%) Dell
4 12 (9.23%) VMware
5 11 (8.46%) IBM
6 9 (6.92%) Cisco
6 9 (6.92%) SAP
6 9 (6.92%) Splunk
7 8 (6.15%) CyberArk
7 8 (6.15%) Databricks
7 8 (6.15%) EMC
7 8 (6.15%) HP
7 8 (6.15%) Isilon
7 8 (6.15%) Qualys
7 8 (6.15%) Serena
7 8 (6.15%) ServiceNow
8 5 (3.85%) MuleSoft
8 5 (3.85%) Salesforce
9 3 (2.31%) ESRI
9 3 (2.31%) Murex