Unix Contracts in London

Unix
England > London

The table below provides summary statistics for contract job vacancies advertised in London requiring Unix skills. It includes a benchmarking guide to the contractor rates offered in vacancies that cited Unix over the 6 months leading up to 26 July 2024, comparing them to the same period in the previous two years.

6 months to
26 Jul 2024
Same period 2023 Same period 2022
Rank 119 84 109
Rank change year-on-year -35 +25 -1
Contract jobs citing Unix 359 703 1,011
As % of all contract jobs advertised in London 2.17% 2.87% 2.52%
As % of the Operating Systems category 17.76% 19.13% 18.39%
Number of daily rates quoted 250 476 666
10th Percentile £350 £401 £452
25th Percentile £425 £488 £513
Median daily rate (50th Percentile) £550 £575 £600
Median % change year-on-year -4.35% -4.17% +4.35%
75th Percentile £675 £653 £675
90th Percentile £850 £750 £750
England median daily rate £524 £550 £550
% change year-on-year -4.77% - +5.77%
Number of hourly rates quoted 4 6 3
10th Percentile £22.59 £46.88 £65.15
25th Percentile £23.37 £52.38 £69.13
Median hourly rate £23.80 £69.75 £76.50
Median % change year-on-year -65.88% -8.82% +34.80%
75th Percentile - £75.44 £79.88
90th Percentile - £79.88 £81.45
England median hourly rate £27.50 £65.50 £76.50
% change year-on-year -58.02% -14.38% +93.67%

All Operating Systems
London

Unix falls under the Operating Systems category. For comparison with the information above, the following table provides summary statistics for all contract job vacancies requiring operating system skills in London.

Contract vacancies with a requirement for operating system skills 2,021 3,674 5,499
As % of all contract IT jobs advertised in London 12.24% 14.99% 13.71%
Number of daily rates quoted 1,414 2,675 4,024
10th Percentile £213 £210 £231
25th Percentile £350 £400 £413
Median daily rate (50th Percentile) £500 £540 £550
Median % change year-on-year -7.41% -1.82% +4.76%
75th Percentile £600 £663 £670
90th Percentile £738 £750 £763
England median daily rate £475 £500 £500
% change year-on-year -5.00% - +6.38%
Number of hourly rates quoted 53 58 86
10th Percentile £16.24 £18.93 £15.00
25th Percentile £20.00 £22.75 £20.25
Median hourly rate £22.00 £48.75 £23.91
Median % change year-on-year -54.87% +103.89% -1.81%
75th Percentile £29.38 £63.38 £41.13
90th Percentile £61.14 £83.23 £62.75
England median hourly rate £27.00 £42.50 £22.50
% change year-on-year -36.47% +88.89% +32.35%

Unix
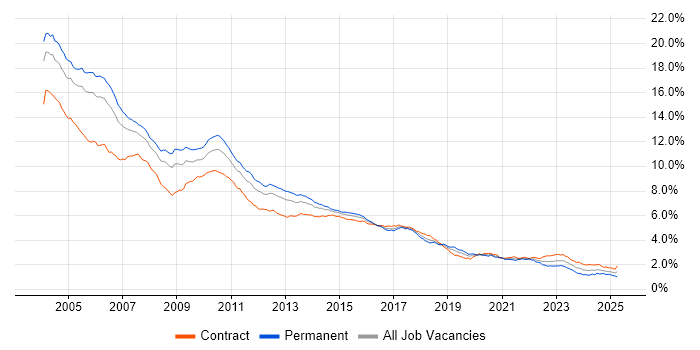
Job Vacancy Trend in London

Job postings citing Unix as a proportion of all IT jobs advertised in London.

Job vacancy trend for Unix in London

Unix
Contractor Daily Rate Trend in London

3-month moving average daily rate quoted in jobs citing Unix in London.

Daily rate trend for Unix in London

Unix
Daily Rate Histogram in London

Daily rate distribution for jobs citing Unix in London over the 6 months to 26 July 2024.

Daily rate histogram for Unix in London

Unix
Contractor Hourly Rate Trend in London

3-month moving average hourly rates quoted in jobs citing Unix in London.

Hourly rate trend for Unix in London

Unix
Contract Job Locations in London

The table below looks at the demand and provides a guide to the median contractor rates quoted in IT jobs citing Unix within the London region over the 6 months to 26 July 2024. The 'Rank Change' column provides an indication of the change in demand within each location based on the same 6 month period last year.

Location Rank Change
on Same Period
Last Year
Matching
Contract
IT Job Ads
Median
Daily Rate
Past 6 Months
Median Daily Rate
% Change
on Same Period
Last Year
Live
Jobs
Central London -1 34 £525 -6.67% 9
South London +13 11 £567 +19.37%
West London +35 7 £375 -22.08% 3
East London -4 5 £450 -15.01%
Unix
England

Unix
Co-occurring Skills and Capabilities in London by Category

The follow tables expand on the table above by listing co-occurrences grouped by category. The same employment type, locality and period is covered with up to 20 co-occurrences shown in each of the following categories:

Application Platforms
1 15 (4.18%) nginx
2 10 (2.79%) Tomcat
3 9 (2.51%) Confluence
4 8 (2.23%) Apache
4 8 (2.23%) IIS
4 8 (2.23%) JBoss
5 6 (1.67%) Apache Spark
5 6 (1.67%) Microsoft Exchange
6 5 (1.39%) WebLogic
6 5 (1.39%) WebSphere
7 4 (1.11%) SharePoint
8 3 (0.84%) Adobe Experience Manager
8 3 (0.84%) CMS
8 3 (0.84%) MS Project Server
8 3 (0.84%) Sitecore CMS
9 2 (0.56%) NetWeaver
10 1 (0.28%) Oracle SOA Suite
10 1 (0.28%) StreamWeaver
Applications
1 17 (4.74%) Microsoft Excel
2 8 (2.23%) MS Visio
3 5 (1.39%) Microsoft Office
3 5 (1.39%) Microsoft Project
4 3 (0.84%) Adobe Captivate
5 2 (0.56%) Microsoft PowerPoint
6 1 (0.28%) EngageOne
Business Applications
1 7 (1.95%) ION MarketView
2 6 (1.67%) Temenos T24
3 3 (0.84%) Shopify
4 2 (0.56%) Advent Geneva
4 2 (0.56%) Front Arena
4 2 (0.56%) ION Anvil
4 2 (0.56%) SAP IBP
5 1 (0.28%) BusinessWorks
5 1 (0.28%) Endur
5 1 (0.28%) Oracle BPM
Cloud Services
1 75 (20.89%) AWS
2 50 (13.93%) Azure
3 27 (7.52%) PaaS
4 16 (4.46%) GCP
5 13 (3.62%) GitHub
5 13 (3.62%) Serverless
6 10 (2.79%) Amazon EC2
7 9 (2.51%) Amazon S3
8 8 (2.23%) Amazon CloudWatch
8 8 (2.23%) AWS Elastic Beanstalk
8 8 (2.23%) IaaS
8 8 (2.23%) Microsoft 365
8 8 (2.23%) Rubrik
9 7 (1.95%) Amazon EKS
9 7 (1.95%) Amazon SQS
9 7 (1.95%) AWS Lambda
9 7 (1.95%) Cloud Computing
10 6 (1.67%) AWS KMS
11 5 (1.39%) Azure App Service
11 5 (1.39%) Azure Service Bus
Communications & Networking
1 34 (9.47%) Firewall
2 18 (5.01%) DNS
2 18 (5.01%) Internet
3 12 (3.34%) FTP
4 11 (3.06%) SSH
5 10 (2.79%) Kerberos
5 10 (2.79%) SSL
6 9 (2.51%) Cisco Nexus
7 8 (2.23%) HTTP
8 7 (1.95%) TCP/IP
9 6 (1.67%) LAN
10 5 (1.39%) SNMP
10 5 (1.39%) Wi-Fi
11 4 (1.11%) DHCP
11 4 (1.11%) DKIM
11 4 (1.11%) DMARC
11 4 (1.11%) NAS
11 4 (1.11%) SAN
12 3 (0.84%) Extranet
12 3 (0.84%) VPN
Database & Business Intelligence
1 39 (10.86%) SQL Server
2 31 (8.64%) Relational Database
3 23 (6.41%) MongoDB
4 21 (5.85%) RDBMS
5 17 (4.74%) Hadoop
5 17 (4.74%) NoSQL
6 13 (3.62%) Oracle Database
6 13 (3.62%) PostgreSQL
7 12 (3.34%) MySQL
8 11 (3.06%) KDB
9 9 (2.51%) Azure SQL Database
10 7 (1.95%) DB2
11 5 (1.39%) Amazon RDS
11 5 (1.39%) HBase
11 5 (1.39%) Oracle Exadata
11 5 (1.39%) Redis
12 4 (1.11%) Apache Cassandra
12 4 (1.11%) Big Data
13 3 (0.84%) Amazon Redshift
13 3 (0.84%) Apache Hive
Development Applications
1 45 (12.53%) Git
2 37 (10.31%) Jenkins
3 29 (8.08%) JIRA
4 18 (5.01%) Mockito
5 16 (4.46%) Cucumber
6 14 (3.90%) Bitbucket
7 13 (3.62%) GitLab
8 12 (3.34%) TeamCity
9 11 (3.06%) JUnit
9 11 (3.06%) Maven
10 9 (2.51%) Artifactory
10 9 (2.51%) Sonatype Nexus
11 6 (1.67%) Oracle APEX
12 5 (1.39%) Selenium
13 4 (1.11%) Subversion
13 4 (1.11%) Visual Studio
14 3 (0.84%) Atlassian Bamboo
14 3 (0.84%) Burp Suite
14 3 (0.84%) Gatling
14 3 (0.84%) ScalaTest
General
1 151 (42.06%) Finance
2 88 (24.51%) Social Skills
3 78 (21.73%) Banking
4 48 (13.37%) Analytical Skills
5 30 (8.36%) Investment Banking
6 26 (7.24%) Public Sector
7 17 (4.74%) Financial Institution
7 17 (4.74%) Front Office
8 12 (3.34%) Back Office
9 11 (3.06%) Retail
10 8 (2.23%) Marketing
11 7 (1.95%) Influencing Skills
12 6 (1.67%) Electronics
13 5 (1.39%) Documentation Skills
13 5 (1.39%) Telecoms
14 4 (1.11%) Inclusion and Diversity
14 4 (1.11%) Manufacturing
15 3 (0.84%) Retail Banking
15 3 (0.84%) Wholesale Banking
16 2 (0.56%) Military
Job Titles
1 98 (27.30%) Developer
2 41 (11.42%) Senior
3 40 (11.14%) Java Developer
4 26 (7.24%) Analyst
5 24 (6.69%) Senior Developer
6 23 (6.41%) DevOps Engineer
7 18 (5.01%) Senior Java Developer
8 17 (4.74%) Consultant
9 14 (3.90%) Applications Support
10 13 (3.62%) Implementation Specialist
10 13 (3.62%) Senior DevOps
10 13 (3.62%) SQL Developer
11 12 (3.34%) Architect
11 12 (3.34%) Network Engineer
11 12 (3.34%) Pensions Analyst
12 11 (3.06%) Automation Engineer
12 11 (3.06%) Support Engineer
13 10 (2.79%) Vulnerability Specialist
14 9 (2.51%) Data Engineer
14 9 (2.51%) Lead
Libraries, Frameworks & Software Standards
1 45 (12.53%) Kafka
2 40 (11.14%) Spring
3 32 (8.91%) Middleware
4 23 (6.41%) REST
5 22 (6.13%) FIX Protocol
5 22 (6.13%) JSON
5 22 (6.13%) XML
6 21 (5.85%) HTML
7 20 (5.57%) Web Services
8 17 (4.74%) J2EE
9 16 (4.46%) Hibernate
10 15 (4.18%) ActiveMQ
10 15 (4.18%) CSS
10 15 (4.18%) LDAP
11 14 (3.90%) JAX-RS
11 14 (3.90%) JPA
12 13 (3.62%) SOAP
13 12 (3.34%) Rendezvous
14 11 (3.06%) Sass
15 8 (2.23%) WebSockets
Miscellaneous
1 25 (6.96%) Foreign Exchange (FX)
2 22 (6.13%) Management Information System
3 19 (5.29%) Linux Command Line
3 19 (5.29%) Replication
4 16 (4.46%) Product Ownership
5 14 (3.90%) Data Centre
6 11 (3.06%) Algorithms
6 11 (3.06%) Enterprise Software
6 11 (3.06%) Self-Motivation
7 10 (2.79%) Derivative
7 10 (2.79%) Fixed Income
7 10 (2.79%) Onboarding
7 10 (2.79%) Public Cloud
8 8 (2.23%) Cloud Native
8 8 (2.23%) Data Structures
8 8 (2.23%) Distributed Systems
9 7 (1.95%) Equities
9 7 (1.95%) Hedge funds
9 7 (1.95%) Market Risk
10 6 (1.67%) Data Protection Act
Operating Systems
1 214 (59.61%) Linux
2 122 (33.98%) Windows
3 33 (9.19%) Red Hat Enterprise Linux
4 16 (4.46%) Mac OS X
5 12 (3.34%) Windows Server
6 8 (2.23%) Solaris
7 7 (1.95%) Android
7 7 (1.95%) Apple iOS
8 6 (1.67%) AIX
9 4 (1.11%) CentOS
9 4 (1.11%) Windows Server 2019
10 3 (0.84%) Windows Server 2012
11 2 (0.56%) Windows Server 2016
12 1 (0.28%) Ubuntu
12 1 (0.28%) VMS
12 1 (0.28%) Windows Server 2008
12 1 (0.28%) zOS
Processes & Methodologies
1 96 (26.74%) Agile
2 78 (21.73%) DevOps
3 58 (16.16%) CI/CD
4 53 (14.76%) Test Automation
5 52 (14.48%) TDD
6 48 (13.37%) Problem-Solving
7 47 (13.09%) Migration
8 44 (12.26%) Microservices
9 35 (9.75%) BDD
10 31 (8.64%) OO
11 29 (8.08%) Pair Programming
12 28 (7.80%) Scrum
13 27 (7.52%) ETL
13 27 (7.52%) SDLC
14 25 (6.96%) Continuous Integration
14 25 (6.96%) Web Development
15 23 (6.41%) Capacity Management
15 23 (6.41%) Computer Science
15 23 (6.41%) Continuous Deployment
15 23 (6.41%) Disaster Recovery
Programming Languages
1 132 (36.77%) SQL
2 128 (35.65%) Python
3 114 (31.75%) Java
4 64 (17.83%) Shell Script
5 49 (13.65%) Perl
6 32 (8.91%) PowerShell
7 27 (7.52%) JavaScript
8 15 (4.18%) Scala
9 11 (3.06%) Bash
9 11 (3.06%) C#
10 10 (2.79%) PHP
11 9 (2.51%) Go
11 9 (2.51%) PL/SQL
11 9 (2.51%) T-SQL
12 6 (1.67%) C++
13 5 (1.39%) Ruby
13 5 (1.39%) TypeScript
13 5 (1.39%) VBA
14 4 (1.11%) AWK
15 2 (0.56%) XPath
Qualifications
1 47 (13.09%) Security Cleared
2 44 (12.26%) SC Cleared
3 35 (9.75%) Degree
4 10 (2.79%) Computer Science Degree
5 8 (2.23%) AWS Certification
6 6 (1.67%) Cisco Certification
6 6 (1.67%) Master's Degree
6 6 (1.67%) Numerate Degree
7 5 (1.39%) CCNA
7 5 (1.39%) CISSP
8 3 (0.84%) ISTQB
8 3 (0.84%) MCSE
8 3 (0.84%) Microsoft Certification
9 2 (0.56%) Azure Certification
9 2 (0.56%) CEH
9 2 (0.56%) CISA
9 2 (0.56%) CISM
9 2 (0.56%) ISEB
9 2 (0.56%) Microsoft Certified Master
9 2 (0.56%) PMI Certification
Quality Assurance & Compliance
1 26 (7.24%) QA
2 11 (3.06%) SLA
3 7 (1.95%) PCI DSS
4 6 (1.67%) Accessibility
5 4 (1.11%) ISO 15022
6 2 (0.56%) EMIR
6 2 (0.56%) NIST
7 1 (0.28%) GDPR
7 1 (0.28%) HIPAA
7 1 (0.28%) ISO/IEC 27001
7 1 (0.28%) Sarbanes-Oxley
7 1 (0.28%) SEPA
System Software
1 36 (10.03%) Active Directory
2 34 (9.47%) Docker
3 15 (4.18%) HDFS
3 15 (4.18%) VMware Infrastructure
4 13 (3.62%) NFS
5 9 (2.51%) Virtual Machines
6 6 (1.67%) Hyper-V
7 3 (0.84%) BitLocker
7 3 (0.84%) Microsoft App-V
8 2 (0.56%) VMware ESXi
9 1 (0.28%) Ceph
9 1 (0.28%) Firmware
9 1 (0.28%) iptables
9 1 (0.28%) KVM
9 1 (0.28%) Lustre
9 1 (0.28%) OpenAM
9 1 (0.28%) OpenDJ
9 1 (0.28%) Samba
9 1 (0.28%) Slurm Workload Manager
9 1 (0.28%) Veritas Cluster Server
Systems Management
1 53 (14.76%) Ansible
1 53 (14.76%) Kubernetes
2 39 (10.86%) Terraform
3 16 (4.46%) Grafana
3 16 (4.46%) Puppet
4 14 (3.90%) Prometheus
5 11 (3.06%) SCCM
6 7 (1.95%) Packer
6 7 (1.95%) Progress Chef
7 6 (1.67%) SCOM
7 6 (1.67%) SCVMM
8 5 (1.39%) EMC NetWorker
8 5 (1.39%) Oracle Enterprise Manager
8 5 (1.39%) Tivoli Storage Manager
9 4 (1.11%) Control-M
9 4 (1.11%) NetBackup
10 3 (0.84%) Argo
10 3 (0.84%) Hadoop YARN
10 3 (0.84%) Microsoft Intune
10 3 (0.84%) Salt
Vendors
1 73 (20.33%) Oracle
2 46 (12.81%) Microsoft
3 23 (6.41%) Red Hat
4 19 (5.29%) Cisco
5 17 (4.74%) CyberArk
5 17 (4.74%) VMware
6 16 (4.46%) Google
7 15 (4.18%) F5
8 14 (3.90%) IBM
8 14 (3.90%) TIBCO
9 12 (3.34%) Dell
9 12 (3.34%) Isilon
9 12 (3.34%) Qualys
9 12 (3.34%) SAP
10 11 (3.06%) Bloomberg
10 11 (3.06%) SEEBURGER
10 11 (3.06%) Solace
11 10 (2.79%) Juniper
12 9 (2.51%) EMC
12 9 (2.51%) ION Trading