Retail Contracts in London

Retailing
England > London

The table below looks at the prevalence of the term Retail in contract job vacancies advertised in London. Included is a benchmarking guide to the contractor rates offered in vacancies that have cited Retail over the 6 months to 27 April 2024 with a comparison to the same period over the previous 2 years.

6 months to
27 Apr 2024
Same period 2023 Same period 2022
Rank 78 105 68
Rank change year-on-year +27 -37 +27
Contract jobs citing Retail 506 691 1,487
As % of all contract jobs advertised in London 2.86% 2.55% 3.82%
As % of the General category 4.52% 4.02% 6.40%
Number of daily rates quoted 305 431 940
10th Percentile £300 £325 £413
25th Percentile £413 £450 £500
Median daily rate (50th Percentile) £513 £540 £584
Median % change year-on-year -5.09% -7.49% +11.19%
75th Percentile £650 £625 £700
90th Percentile £745 £788 £800
England median daily rate £520 £525 £538
% change year-on-year -0.95% -2.33% +7.50%
Number of hourly rates quoted 9 2 6
10th Percentile - - £26.25
25th Percentile £18.25 £31.17 £32.19
Median hourly rate £20.00 £31.92 £50.00
Median % change year-on-year -37.34% -36.16% -
75th Percentile £30.12 £32.67 £58.06
90th Percentile £47.15 - £66.25
England median hourly rate £16.00 £19.81 £16.50
% change year-on-year -19.23% +20.06% +26.92%

All General Skills
London

Retail is in the General Skills category. The following table is for comparison with the above and provides summary statistics for all contract job vacancies advertised in London with a requirement for common skills.

Contract vacancies with a requirement for common skills 11,194 17,186 23,250
As % of all contract IT jobs advertised in London 63.21% 63.47% 59.72%
Number of daily rates quoted 7,991 12,426 16,753
10th Percentile £336 £375 £381
25th Percentile £450 £481 £475
Median daily rate (50th Percentile) £575 £600 £575
Median % change year-on-year -4.17% +4.35% +9.52%
75th Percentile £700 £725 £700
90th Percentile £801 £825 £794
England median daily rate £538 £550 £550
% change year-on-year -2.27% - +10.00%
Number of hourly rates quoted 245 225 296
10th Percentile £16.00 £16.69 £19.89
25th Percentile £18.25 £21.24 £25.68
Median hourly rate £28.50 £32.50 £36.00
Median % change year-on-year -12.31% -9.72% +30.91%
75th Percentile £43.75 £58.75 £49.38
90th Percentile £65.45 £70.00 £64.56
England median hourly rate £30.00 £34.31 £21.30
% change year-on-year -12.56% +61.08% -5.33%

Retail
Job Vacancy Trend in London

Job postings citing Retail as a proportion of all IT jobs advertised in London.
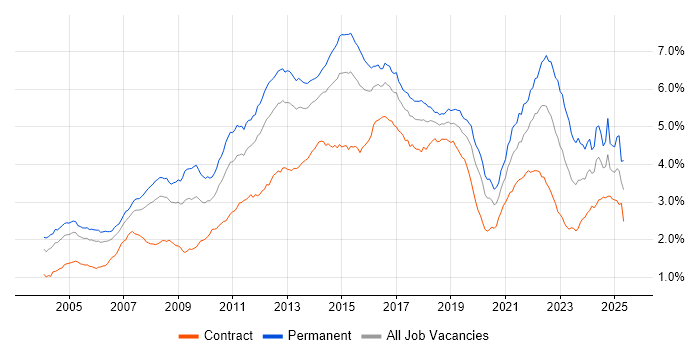
Job vacancy trend for Retail in London

Retail
Contractor Daily Rate Trend in London

3-month moving average daily rate quoted in jobs citing Retail in London.

Daily rate trend for Retail in London

Retail
Daily Rate Histogram in London

Daily rate distribution for jobs citing Retail in London over the 6 months to 27 April 2024.

Daily rate histogram for Retail in London

Retail
Contractor Hourly Rate Trend in London

3-month moving average hourly rates quoted in jobs citing Retail in London.

Hourly rate trend for Retail in London

Retail
Hourly Rate Histogram in London

Hourly rate distribution of jobs citing Retail in London over the 6 months to 27 April 2024.

Hourly rate histogram for Retail in London

Retail
Contract Job Locations in London

The table below looks at the demand and provides a guide to the median contractor rates quoted in IT jobs citing Retail within the London region over the 6 months to 27 April 2024. The 'Rank Change' column provides an indication of the change in demand within each location based on the same 6 month period last year.

Location Rank Change
on Same Period
Last Year
Matching
Contract
IT Job Ads
Median
Daily Rate
Past 6 Months
Median Daily Rate
% Change
on Same Period
Last Year
Live
Jobs
Central London +24 78 £525 - 65
West London +21 7 £250 -16.67% 34
East London -5 1 £575 +55.93% 15
Retail
England

Retail
Co-occurring Skills and Capabilities in London by Category

The follow tables expand on the table above by listing co-occurrences grouped by category. The same employment type, locality and period is covered with up to 20 co-occurrences shown in each of the following categories:

Application Platforms
1 7 (1.38%) Adobe Experience Manager
2 5 (0.99%) CMS
3 4 (0.79%) Headless CMS
3 4 (0.79%) SharePoint
4 3 (0.59%) Confluence
5 2 (0.40%) Anypoint
5 2 (0.40%) Microsoft Exchange
6 1 (0.20%) Apache Airflow
6 1 (0.20%) Apache Solr
6 1 (0.20%) Appian
6 1 (0.20%) Jupyter
6 1 (0.20%) Oracle Workflow
6 1 (0.20%) Umbraco
Applications
1 20 (3.95%) Microsoft Excel
2 12 (2.37%) Microsoft Office
2 12 (2.37%) Microsoft PowerPoint
3 10 (1.98%) Photoshop
4 9 (1.78%) Adobe Creative Suite
5 8 (1.58%) Adobe Illustrator
6 6 (1.19%) InDesign
7 5 (0.99%) Spreadsheet
8 4 (0.79%) Adobe Premiere
8 4 (0.79%) Trello
9 3 (0.59%) Adobe After Effects
10 2 (0.40%) Final Cut Pro
10 2 (0.40%) Microsoft Project
10 2 (0.40%) MS Visio
10 2 (0.40%) Sketch
11 1 (0.20%) Blender
11 1 (0.20%) CINEMA 4D
11 1 (0.20%) InVision
Business Applications
1 25 (4.94%) Shopify
2 23 (4.55%) SAP S/4HANA
3 22 (4.35%) Dynamics AX
4 6 (1.19%) Oracle Payables
4 6 (1.19%) SAP Retail
5 4 (0.79%) NetSuite
5 4 (0.79%) SAP CO
5 4 (0.79%) SAP ERP
5 4 (0.79%) SAP FI
5 4 (0.79%) SAP FI/CO
6 3 (0.59%) OpenText VIM for SAP
7 2 (0.40%) Oracle Retail
7 2 (0.40%) SAP Forecasting and Replenishment
7 2 (0.40%) WebTrends
8 1 (0.20%) Magento
8 1 (0.20%) Payment Gateway
8 1 (0.20%) Salesforce CRM
8 1 (0.20%) SAP APO
8 1 (0.20%) SAP Hybris
8 1 (0.20%) SAP SD
Cloud Services
1 74 (14.62%) Azure
2 42 (8.30%) AWS
2 42 (8.30%) Power Platform
3 33 (6.52%) GCP
4 32 (6.32%) Dynamics 365
5 27 (5.34%) Azure DevOps
6 21 (4.15%) Power Automate
6 21 (4.15%) PowerApps
7 20 (3.95%) BigCommerce
8 16 (3.16%) Google Analytics
9 14 (2.77%) Serverless
10 12 (2.37%) Adobe Analytics
11 11 (2.17%) GitHub
12 10 (1.98%) Microsoft 365
13 9 (1.78%) AWS Lambda
14 8 (1.58%) Apigee
14 8 (1.58%) Figma
15 6 (1.19%) Amazon S3
15 6 (1.19%) SaaS
16 5 (0.99%) Google Workspace
Communications & Networking
1 6 (1.19%) Firewall
2 2 (0.40%) ATM
2 2 (0.40%) Cisco IOS
2 2 (0.40%) DHCP
2 2 (0.40%) DNS
2 2 (0.40%) FTP
2 2 (0.40%) Network Security
2 2 (0.40%) RFID
2 2 (0.40%) SCCP
2 2 (0.40%) TCP/IP
2 2 (0.40%) VPN
2 2 (0.40%) Wi-Fi
2 2 (0.40%) Wireless
3 1 (0.20%) Cisco Nexus
3 1 (0.20%) Internet
3 1 (0.20%) Software-Defined Networking
3 1 (0.20%) VLAN
Database & Business Intelligence
1 42 (8.30%) Power BI
2 29 (5.73%) Data Lake
3 13 (2.57%) SQL Server
4 11 (2.17%) BigQuery
4 11 (2.17%) MySQL
5 10 (1.98%) Tableau
6 9 (1.78%) Metadata
7 8 (1.58%) Data Warehouse
8 7 (1.38%) Looker
9 6 (1.19%) Data Mining
9 6 (1.19%) PostgreSQL
10 5 (0.99%) Big Data
10 5 (0.99%) NoSQL
10 5 (0.99%) SAP HANA
11 4 (0.79%) Elasticsearch
11 4 (0.79%) MongoDB
11 4 (0.79%) Oracle Reports
11 4 (0.79%) Relational Database
12 3 (0.59%) Apache Cassandra
13 2 (0.40%) Azure SQL Database
Development Applications
1 15 (2.96%) Jenkins
2 12 (2.37%) JIRA
3 11 (2.17%) Git
4 8 (1.58%) Postman
5 7 (1.38%) ERwin
6 6 (1.19%) Maven
6 6 (1.19%) Selenium
7 4 (0.79%) Visual Website Optimizer
8 3 (0.59%) GitLab
9 2 (0.40%) Appium
9 2 (0.40%) Atlassian Bamboo
9 2 (0.40%) PHPUnit
9 2 (0.40%) TeamCity
9 2 (0.40%) Visual Studio Team System
10 1 (0.20%) Axure RP
10 1 (0.20%) Cypress.io
10 1 (0.20%) Mercurial
10 1 (0.20%) SilkCentral
10 1 (0.20%) Visual Studio Code
10 1 (0.20%) Zephyr
General
1 142 (28.06%) Social Skills
2 140 (27.67%) Finance
3 69 (13.64%) Analytical Skills
4 66 (13.04%) Marketing
5 56 (11.07%) Banking
6 34 (6.72%) Investment Banking
7 29 (5.73%) Corporate Banking
8 28 (5.53%) Public Sector
9 26 (5.14%) Manufacturing
9 26 (5.14%) Retail Banking
10 21 (4.15%) General Ledger
11 19 (3.75%) Organisational Skills
12 11 (2.17%) Legal
13 10 (1.98%) Advertising
13 10 (1.98%) Electronics
13 10 (1.98%) Presentation Skills
13 10 (1.98%) Telecoms
14 7 (1.38%) Influencing Skills
15 5 (0.99%) Automotive
15 5 (0.99%) Wholesale Banking
Job Titles
1 59 (11.66%) Project Manager
2 56 (11.07%) Analyst
3 54 (10.67%) Architect
4 45 (8.89%) Consultant
5 44 (8.70%) Senior
6 38 (7.51%) Lead
7 37 (7.31%) Developer
8 29 (5.73%) Business Analyst
9 26 (5.14%) Solutions Architect
10 19 (3.75%) Microsoft Consultant
11 15 (2.96%) Product Manager
12 13 (2.57%) Data Analyst
12 13 (2.57%) Dynamics 365 Consultant
13 12 (2.37%) Enterprise Architect
13 12 (2.37%) Product Owner
14 11 (2.17%) Data Architect
14 11 (2.17%) Functional Consultant
15 10 (1.98%) PMO Manager
15 10 (1.98%) SAP Consultant
16 9 (1.78%) Java Engineer
Libraries, Frameworks & Software Standards
1 17 (3.36%) HTML
2 16 (3.16%) CSS
3 14 (2.77%) React
3 14 (2.77%) VML
4 13 (2.57%) Spring
5 12 (2.37%) .NET
6 11 (2.17%) Node.js
7 10 (1.98%) GraphQL
7 10 (1.98%) jQuery
7 10 (1.98%) REST
7 10 (1.98%) Spring Boot
8 8 (1.58%) AngularJS
8 8 (1.58%) JSON
8 8 (1.58%) Swagger
9 7 (1.38%) Web Services
10 6 (1.19%) Sass
11 5 (0.99%) DOM
12 4 (0.79%) .NET Framework
12 4 (0.79%) EDI
12 4 (0.79%) SOAP
Miscellaneous
1 25 (4.94%) Data Structures
2 24 (4.74%) FMCG
3 18 (3.56%) Product Ownership
4 13 (2.57%) Management Information System
5 9 (1.78%) Data Protection Act
5 9 (1.78%) Marketing Technology
6 8 (1.58%) Algorithms
6 8 (1.58%) Self-Motivation
7 7 (1.38%) Credit Risk
7 7 (1.38%) Life Science
7 7 (1.38%) Mobile App
7 7 (1.38%) Wiki
8 6 (1.19%) EPoS
8 6 (1.19%) Greenfield Project
9 5 (0.99%) Mobile Banking
9 5 (0.99%) Taxonomies
10 4 (0.79%) Replication
10 4 (0.79%) Team-Oriented Environment
11 3 (0.59%) Distributed Architecture
11 3 (0.59%) Onboarding
Operating Systems
1 14 (2.77%) Windows
2 13 (2.57%) Apple iOS
3 11 (2.17%) Android
4 5 (0.99%) Linux
4 5 (0.99%) Unix
5 4 (0.79%) Mac OS
6 3 (0.59%) Mac OS X
6 3 (0.59%) Windows 10
6 3 (0.59%) Windows Server
7 1 (0.20%) Windows Server 2012
Processes & Methodologies
1 114 (22.53%) Agile
2 70 (13.83%) E-Commerce
3 63 (12.45%) DevOps
4 61 (12.06%) Analytics
5 56 (11.07%) Problem-Solving
6 47 (9.29%) Business Intelligence
6 47 (9.29%) Project Management
7 46 (9.09%) Stakeholder Management
8 44 (8.70%) Customer Experience
9 38 (7.51%) Roadmaps
10 35 (6.92%) CI/CD
11 33 (6.52%) Scrum
12 30 (5.93%) Software Engineering
13 29 (5.73%) Microservices
14 28 (5.53%) Accounts Payable
15 27 (5.34%) Migration
15 27 (5.34%) Requirements Gathering
15 27 (5.34%) User Experience
15 27 (5.34%) Wealth Management
16 26 (5.14%) Data Modelling
Programming Languages
1 44 (8.70%) SQL
2 42 (8.30%) Python
3 22 (4.35%) Java
3 22 (4.35%) JavaScript
4 16 (3.16%) C#
5 8 (1.58%) Go
5 8 (1.58%) TypeScript
6 6 (1.19%) PHP
7 4 (0.79%) ABAP
8 3 (0.59%) Data Analysis Expressions
8 3 (0.59%) R
9 2 (0.40%) Scala
10 1 (0.20%) Apex Code
10 1 (0.20%) Bash
10 1 (0.20%) C
10 1 (0.20%) C++
10 1 (0.20%) Kotlin
10 1 (0.20%) Perl
10 1 (0.20%) PL/SQL
10 1 (0.20%) Ruby
Qualifications
1 66 (13.04%) Degree
2 11 (2.17%) PMI Certification
3 10 (1.98%) PMP
4 8 (1.58%) Computer Science Degree
4 8 (1.58%) Master's Degree
5 7 (1.38%) Microsoft Certification
5 7 (1.38%) SAP Certification
6 5 (0.99%) SC Cleared
6 5 (0.99%) Security Cleared
7 4 (0.79%) CEH
7 4 (0.79%) CISSP
8 3 (0.59%) CIMA
9 2 (0.40%) CISA
9 2 (0.40%) CISM
9 2 (0.40%) CompTIA Security+
9 2 (0.40%) CREST Certified
9 2 (0.40%) CSSLP
9 2 (0.40%) MCITP
9 2 (0.40%) PhD
10 1 (0.20%) SANS
Quality Assurance & Compliance
1 22 (4.35%) PMO
2 19 (3.75%) QA
3 16 (3.16%) Data Quality
4 10 (1.98%) GDPR
5 7 (1.38%) SLA
6 4 (0.79%) Accessibility
6 4 (0.79%) PCI DSS
7 3 (0.59%) Actionable Recommendations
7 3 (0.59%) GAAP
7 3 (0.59%) NIST
8 2 (0.40%) COBIT
8 2 (0.40%) IFRS
8 2 (0.40%) ISO 22301
8 2 (0.40%) ISO/IEC 27001
8 2 (0.40%) P3O
8 2 (0.40%) PSD2
9 1 (0.20%) IFRS 17
9 1 (0.20%) IFRS 9
9 1 (0.20%) ISO 20022
System Software
1 12 (2.37%) Active Directory
2 11 (2.17%) Docker
3 3 (0.59%) Virtual Machines
4 1 (0.20%) Firmware
4 1 (0.20%) Virtual Desktop
Systems Management
1 10 (1.98%) Terraform
2 8 (1.58%) Ansible
2 8 (1.58%) Kubernetes
3 4 (0.79%) Grafana
3 4 (0.79%) Puppet
4 3 (0.59%) Kibana
4 3 (0.59%) Progress Chef
5 2 (0.40%) AirWatch
5 2 (0.40%) Consul
5 2 (0.40%) Jamf Pro
5 2 (0.40%) Nessus
5 2 (0.40%) Packer
5 2 (0.40%) SCCM
6 1 (0.20%) FortiGate
6 1 (0.20%) logstash
6 1 (0.20%) Prometheus
Vendors
1 84 (16.60%) Microsoft
2 69 (13.64%) SAP
3 49 (9.68%) Google
4 45 (8.89%) Adobe
5 28 (5.53%) Salesforce
6 23 (4.55%) Oracle
7 20 (3.95%) Sitecore
8 11 (2.17%) Apple
9 10 (1.98%) Dell
9 10 (1.98%) Optimizely
10 9 (1.78%) Databricks
10 9 (1.78%) Intel
11 8 (1.58%) Monetate
11 8 (1.58%) Planview
12 7 (1.38%) Sparx
13 6 (1.19%) Cisco
13 6 (1.19%) Ensighten
13 6 (1.19%) Omniture
13 6 (1.19%) Tealium
14 4 (0.79%) Cadence