Investment Banking Contract Job Trends in London

Investment Banking
England > London

The table below looks at the prevalence of the term Investment Banking in contract job vacancies in London. Included is a benchmarking guide to the contractor rates offered in vacancies that cited Investment Banking over the 6 months leading up to 20 November 2025, comparing them to the same period in the previous two years.

6 months to
20 Nov 2025
Same period 2024 Same period 2023
Rank 94 58 58
Rank change year-on-year -36 0 -4
Contract jobs citing Investment Banking 452 570 788
As % of all contract jobs in London 3.20% 3.62% 3.98%
As % of the General category 4.68% 5.76% 6.12%
Number of daily rates quoted 307 409 599
10th Percentile £458 £500 £488
25th Percentile £544 £613 £563
Median daily rate (50th Percentile) £675 £738 £700
Median % change year-on-year -8.47% +5.36% -5.41%
75th Percentile £825 £850 £850
90th Percentile £957 £888 £1,000
England median daily rate £675 £706 £700
% change year-on-year -4.42% +0.89% -4.11%
Number of hourly rates quoted 5 1 0
10th Percentile £20.82 - -
25th Percentile £23.75 £76.25 -
Median hourly rate £40.73 £77.50 -
Median % change year-on-year -47.45% - -
75th Percentile £70.00 £78.75 -
90th Percentile £81.25 - -
England median hourly rate £40.73 £77.50 £18.50
% change year-on-year -47.45% +318.92% -54.32%

All General Skills
London

Investment Banking falls under the General Skills category. For comparison with the information above, the following table provides summary statistics for all contract job vacancies requiring common skills in London.

Contract vacancies with a requirement for common skills 9,653 9,900 12,879
As % of all contract IT jobs advertised in London 68.28% 62.96% 65.12%
Number of daily rates quoted 6,312 6,356 9,318
10th Percentile £325 £325 £350
25th Percentile £425 £450 £463
Median daily rate (50th Percentile) £538 £575 £575
Median % change year-on-year -6.52% - -4.17%
75th Percentile £671 £695 £700
90th Percentile £783 £825 £800
England median daily rate £500 £530 £550
% change year-on-year -5.66% -3.64% -
Number of hourly rates quoted 200 112 170
10th Percentile £17.50 £17.55 £18.48
25th Percentile £20.18 £27.38 £21.31
Median hourly rate £26.40 £37.79 £35.44
Median % change year-on-year -30.13% +6.62% +8.21%
75th Percentile £45.44 £54.06 £58.75
90th Percentile £70.20 £76.13 £75.13
England median hourly rate £24.61 £31.97 £32.32
% change year-on-year -23.02% -1.08% +25.71%

Investment Banking
Job Vacancy Trend in London

Historical trend showing the proportion of contract IT job postings citing Investment Banking relative to all contract IT jobs advertised in London.
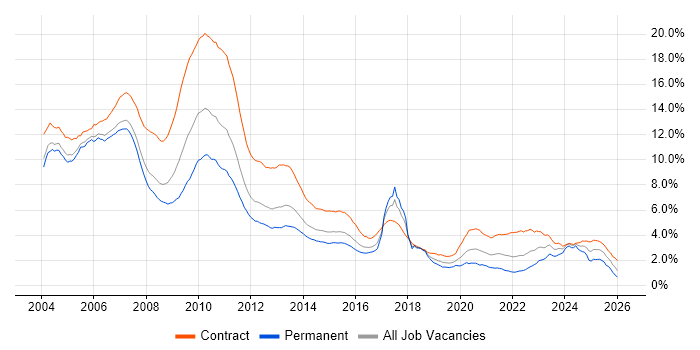
Investment Banking job vacancy trend in London

Investment Banking
Daily Rate Trend in London

Contractor daily rate distribution trend for jobs in London citing Investment Banking.

Contractor daily rate distribution trend for jobs in London citing Investment Banking

Investment Banking
Daily Rate Histogram in London

Daily rate distribution for jobs citing Investment Banking in London over the 6 months to 20 November 2025.

Daily rate histogram for Investment Banking in London

Investment Banking
Hourly Rate Trend in London

Contractor hourly rate distribution trend for jobs in London citing Investment Banking.

Contractor hourly rate distribution trend for jobs in London citing Investment Banking

Investment Banking
Hourly Rate Histogram in London

Hourly rate distribution of jobs citing Investment Banking in London over the 6 months to 20 November 2025.

Hourly rate histogram for Investment Banking in London

Investment Banking
Contract Job Locations in London

The table below looks at the demand and provides a guide to the median contractor rates quoted in IT jobs citing Investment Banking within the London region over the 6 months to 20 November 2025. The 'Rank Change' column provides an indication of the change in demand within each location based on the same 6 month period last year.

Location Rank Change
on Same Period
Last Year
Matching
Contract
IT Job Ads
Median
Daily Rate
Past 6 Months
Median Daily Rate
% Change
on Same Period
Last Year
Live
Jobs
Central London -8 60 £668 +2.69% 44
East London +11 6 £658 +14.43%
South London -8 3 £600 -15.79%
West London - 1 - -
Investment Banking
England

Investment Banking
Co-Occurring Skills & Capabilities in London by Category

The following tables expand on the one above by listing co-occurrences grouped by category. They cover the same employment type, locality and period, with up to 20 co-occurrences shown in each category:

Application Platforms
1 35 (7.74%) Apache
1 35 (7.74%) Apache Airflow
2 19 (4.20%) Confluence
3 8 (1.77%) Apache Spark
4 5 (1.11%) SharePoint
5 4 (0.88%) MQSeries
6 3 (0.66%) CMS
7 1 (0.22%) Appian
7 1 (0.22%) HCL Notes
7 1 (0.22%) Tomcat
Applications
1 16 (3.54%) Microsoft Excel
2 9 (1.99%) Microsoft Office
3 4 (0.88%) Microsoft PowerPoint
4 3 (0.66%) Chatbot
4 3 (0.66%) MS Visio
5 2 (0.44%) UserZoom
Business Applications
1 6 (1.33%) Aladdin
2 5 (1.11%) Fidessa
3 4 (0.88%) thinkFolio
4 2 (0.44%) Actimize
5 1 (0.22%) ION Anvil
5 1 (0.22%) ION MarketView
5 1 (0.22%) Markit EDM
5 1 (0.22%) Remedy ITSM
5 1 (0.22%) Salesforce CRM
Cloud Services
1 110 (24.34%) AWS
2 91 (20.13%) Azure
3 39 (8.63%) Snowflake
4 34 (7.52%) dbt
5 31 (6.86%) Power Platform
6 25 (5.53%) Azure DevOps
7 20 (4.42%) GCP
8 15 (3.32%) GitHub
9 10 (2.21%) Microsoft 365
9 10 (2.21%) Serverless
10 9 (1.99%) GitHub Actions
11 7 (1.55%) PowerApps
12 6 (1.33%) Azure AI
12 6 (1.33%) Azure AKS
12 6 (1.33%) Azure Data Factory
12 6 (1.33%) Figma
12 6 (1.33%) Microsoft Copilot
13 5 (1.11%) Azure Cosmos DB
13 5 (1.11%) Azure Logic Apps
13 5 (1.11%) ChatGPT
Communications & Networking
1 7 (1.55%) Multicast
2 5 (1.11%) Firewall
3 4 (0.88%) TCP/IP
4 3 (0.66%) VPN
5 2 (0.44%) BGP
5 2 (0.44%) DMZ
5 2 (0.44%) FIX Connectivity
5 2 (0.44%) Network Security
5 2 (0.44%) OSPF
5 2 (0.44%) SMS
5 2 (0.44%) Unicast
6 1 (0.22%) ATM
6 1 (0.22%) DHCP
6 1 (0.22%) DNS
6 1 (0.22%) HTTP
6 1 (0.22%) SAN
6 1 (0.22%) tcpdump
6 1 (0.22%) Wireshark
Database & Business Intelligence
1 35 (7.74%) Amazon Athena
1 35 (7.74%) Data Lake
2 34 (7.52%) Apache Arrow
2 34 (7.52%) Apache Iceberg
2 34 (7.52%) Apache Ignite
2 34 (7.52%) Dremio
3 32 (7.08%) PostgreSQL
4 29 (6.42%) Power BI
5 28 (6.19%) SQL Server
6 22 (4.87%) Relational Database
7 21 (4.65%) MongoDB
8 18 (3.98%) Tableau
9 16 (3.54%) DB2
10 12 (2.65%) Power Query
10 12 (2.65%) Redis
11 11 (2.43%) Data Warehouse
12 10 (2.21%) NoSQL
13 9 (1.99%) Metadata
14 8 (1.77%) KDB
15 5 (1.11%) Elasticsearch
Development Applications
1 35 (7.74%) Git
2 30 (6.64%) JIRA
3 17 (3.76%) JUnit
4 12 (2.65%) Jenkins
5 9 (1.99%) Selenium
6 8 (1.77%) Cucumber
6 8 (1.77%) GitLab
6 8 (1.77%) Maven
7 7 (1.55%) Bitbucket
7 7 (1.55%) Octopus Deploy
7 7 (1.55%) Postman
8 5 (1.11%) TeamCity
9 4 (0.88%) webpack
10 3 (0.66%) REST Assured
10 3 (0.66%) Sonatype Nexus
10 3 (0.66%) Visual Studio
11 2 (0.44%) Artifactory
11 2 (0.44%) CMake
12 1 (0.22%) Gradle
12 1 (0.22%) Visual Studio Code
General
1 452 (100.00%) Banking
2 288 (63.72%) Finance
3 154 (34.07%) Social Skills
4 120 (26.55%) Front Office
5 90 (19.91%) Analytical Skills
6 35 (7.74%) Corporate Banking
7 34 (7.52%) Retail
8 33 (7.30%) Retail Banking
9 24 (5.31%) Financial Institution
10 20 (4.42%) Back Office
11 10 (2.21%) Legal
12 9 (1.99%) Influencing Skills
13 5 (1.11%) Documentation Skills
13 5 (1.11%) Organisational Skills
14 4 (0.88%) Marketing
15 3 (0.66%) French Language
15 3 (0.66%) Inclusion and Diversity
16 2 (0.44%) Portuguese Language
16 2 (0.44%) Presentation Skills
16 2 (0.44%) Spanish Language
Job Titles
1 147 (32.52%) Developer
2 104 (23.01%) Senior
3 86 (19.03%) Analyst
4 65 (14.38%) Java Developer
5 59 (13.05%) Business Analyst
6 50 (11.06%) Software Engineer
7 49 (10.84%) Senior Developer
8 40 (8.85%) Python Engineer
9 39 (8.63%) Java Engineer
10 36 (7.96%) AWS Developer
10 36 (7.96%) Java Software Engineer
10 36 (7.96%) Python Software Engineer
10 36 (7.96%) Senior Java Developer
11 35 (7.74%) AWS Engineer
12 34 (7.52%) AWS Software Engineer
12 34 (7.52%) Senior Software Engineer
13 33 (7.30%) Senior Java Engineer
13 33 (7.30%) Senior Java Software Engineer
14 25 (5.53%) Banking Analyst
14 25 (5.53%) Project Manager
Libraries, Frameworks & Software Standards
1 56 (12.39%) Kafka
1 56 (12.39%) Pandas
2 52 (11.50%) NumPy
3 51 (11.28%) SciPy
4 40 (8.85%) React
5 38 (8.41%) .NET
6 34 (7.52%) gRPC
6 34 (7.52%) Protocol Buffers
7 27 (5.97%) AngularJS
8 22 (4.87%) Spring
9 20 (4.42%) FIX Protocol
10 19 (4.20%) FastAPI
11 17 (3.76%) Flask
11 17 (3.76%) JMS
11 17 (3.76%) Polars
11 17 (3.76%) Vue
12 15 (3.32%) REST
13 9 (1.99%) CSS
14 8 (1.77%) HTML
14 8 (1.77%) XML
Miscellaneous
1 118 (26.11%) Derivative
2 91 (20.13%) Foreign Exchange (FX)
3 70 (15.49%) Equities
3 70 (15.49%) Fixed Income
4 67 (14.82%) Hedge funds
5 34 (7.52%) Pricing Data
6 32 (7.08%) Market Risk
7 28 (6.19%) Management Information System
8 24 (5.31%) Product Ownership
9 20 (4.42%) Onboarding
10 19 (4.20%) Cloud Native
11 18 (3.98%) Data Structures
12 14 (3.10%) Self-Motivation
13 12 (2.65%) Analytical Mindset
14 11 (2.43%) Distributed Systems
15 10 (2.21%) Credit Risk
15 10 (2.21%) Distributed Computing
15 10 (2.21%) Reference Data
16 8 (1.77%) AI Agents
17 6 (1.33%) Data Protection Act
Operating Systems
1 57 (12.61%) Linux
2 12 (2.65%) Windows
3 6 (1.33%) Unix
4 4 (0.88%) Windows 10
5 2 (0.44%) Windows 7
6 1 (0.22%) AIX
6 1 (0.22%) Red Hat Enterprise Linux
6 1 (0.22%) Windows Server
Processes & Methodologies
1 139 (30.75%) Agile
2 93 (20.58%) Problem-Solving
3 84 (18.58%) Software Engineering
4 67 (14.82%) DevOps
5 65 (14.38%) Analytics
6 55 (12.17%) CI/CD
7 54 (11.95%) Stakeholder Management
8 44 (9.73%) Risk Management
9 43 (9.51%) Asset Management
10 40 (8.85%) Multithreading
10 40 (8.85%) Wealth Management
11 39 (8.63%) Computer Science
11 39 (8.63%) Mathematics
12 38 (8.41%) Data Modelling
12 38 (8.41%) Project Management
13 37 (8.19%) Investment Management
14 36 (7.96%) SDLC
15 35 (7.74%) AI
16 34 (7.52%) Data Engineering
16 34 (7.52%) TDD
Programming Languages
1 161 (35.62%) Python
2 150 (33.19%) Java
3 134 (29.65%) SQL
4 71 (15.71%) C#
5 68 (15.04%) JavaScript
6 49 (10.84%) TypeScript
7 33 (7.30%) C++
8 20 (4.42%) PowerShell
8 20 (4.42%) Shell Script
9 17 (3.76%) Rust
10 8 (1.77%) Scala
10 8 (1.77%) VB.NET
11 7 (1.55%) Data Analysis Expressions
12 5 (1.11%) Bicep
12 5 (1.11%) DAML
12 5 (1.11%) T-SQL
13 4 (0.88%) VBA
14 3 (0.66%) Bash
14 3 (0.66%) C
14 3 (0.66%) RPG
Qualifications
1 54 (11.95%) Degree
2 22 (4.87%) Computer Science Degree
3 15 (3.32%) Master's Degree
4 11 (2.43%) PMP
5 8 (1.77%) Numerate Degree
5 8 (1.77%) PMI Certification
6 5 (1.11%) Azure Certification
6 5 (1.11%) CFA
6 5 (1.11%) PhD
7 3 (0.66%) BPSS Clearance
7 3 (0.66%) FFIEC
8 2 (0.44%) CCIE
8 2 (0.44%) Cisco Certification
8 2 (0.44%) CISSP
8 2 (0.44%) IIBA
8 2 (0.44%) Microsoft Certification
8 2 (0.44%) Security Cleared
9 1 (0.22%) CCA
9 1 (0.22%) ITIL Certification
9 1 (0.22%) PRINCE2 Certification
Quality Assurance & Compliance
1 27 (5.97%) QA
2 19 (4.20%) MiFID
3 16 (3.54%) Data Quality
4 12 (2.65%) EMIR
5 7 (1.55%) GDPR
6 5 (1.11%) ISO/IEC 27001
6 5 (1.11%) Sarbanes-Oxley
7 4 (0.88%) Dodd-Frank
7 4 (0.88%) PMO
7 4 (0.88%) SLA
8 3 (0.66%) Accessibility
8 3 (0.66%) Basel III
8 3 (0.66%) SOC 2
9 2 (0.44%) Basel II
9 2 (0.44%) SEPA
10 1 (0.22%) FATCA
10 1 (0.22%) GRC
10 1 (0.22%) ISO 20022
10 1 (0.22%) NIST
10 1 (0.22%) Software Quality Assurance
System Software
1 33 (7.30%) Docker
2 5 (1.11%) Active Directory
3 1 (0.22%) Firmware
3 1 (0.22%) GridGain
3 1 (0.22%) Microsoft App-V
Systems Management
1 39 (8.63%) Kubernetes
2 12 (2.65%) Terraform
3 9 (1.99%) ITRS Geneos
4 6 (1.33%) Ansible
5 4 (0.88%) Kibana
5 4 (0.88%) logstash
5 4 (0.88%) Prometheus
5 4 (0.88%) SCCM
6 3 (0.66%) Argo
6 3 (0.66%) Thomson Reuters DACS
7 2 (0.44%) Grafana
7 2 (0.44%) WSUS
7 2 (0.44%) ZABBIX
8 1 (0.22%) HP SiteScope
8 1 (0.22%) Microsoft Intune
8 1 (0.22%) Oracle Identity Management
8 1 (0.22%) SCOM
8 1 (0.22%) Systems Management Server (SMS)
Vendors
1 37 (8.19%) Microsoft
2 17 (3.76%) Sybase
3 15 (3.32%) Bloomberg
3 15 (3.32%) Oracle
4 13 (2.88%) Databricks
5 11 (2.43%) Solace
6 8 (1.77%) Google
6 8 (1.77%) Murex
7 7 (1.55%) ION Trading
7 7 (1.55%) Refinitiv
7 7 (1.55%) UiPath
8 6 (1.33%) OpenAI
8 6 (1.33%) Salesforce
9 5 (1.11%) Atlassian
9 5 (1.11%) IBM
9 5 (1.11%) Reuters
9 5 (1.11%) SAP
9 5 (1.11%) Splunk
10 4 (0.88%) Portware
10 4 (0.88%) TIBCO