SQL Server Contracts in London

Microsoft SQL Server (MS SQL)
England > London

The table below provides summary statistics for contract job vacancies advertised in London requiring SQL Server skills. It includes a benchmarking guide to the contractor rates offered in vacancies that cited SQL Server over the 6 months leading up to 1 May 2025, comparing them to the same period in the previous two years.

6 months to
1 May 2025
Same period 2024 Same period 2023
Rank 83 40 45
Rank change year-on-year -43 +5 +4
Contract jobs citing SQL Server 409 836 1,334
As % of all contract jobs advertised in London 3.26% 4.69% 4.93%
As % of the Database & Business Intelligence category 14.61% 21.76% 24.02%
Number of daily rates quoted 294 573 1,043
10th Percentile £385 £363 £400
25th Percentile £450 £425 £463
Median daily rate (50th Percentile) £575 £538 £575
Median % change year-on-year +6.98% -6.52% -
75th Percentile £688 £650 £725
90th Percentile £763 £750 £800
England median daily rate £525 £518 £525
% change year-on-year +1.45% -1.43% -
Number of hourly rates quoted 1 0 5
10th Percentile - - £39.05
25th Percentile - - £43.63
Median hourly rate £26.32 - £52.50
75th Percentile - - £67.50
90th Percentile - - £70.50
England median hourly rate £63.75 £40.25 £43.50
% change year-on-year +58.37% -7.47% -10.31%

All Database and Business Intelligence Skills
London

SQL Server falls under the Databases and Business Intelligence category. For comparison with the information above, the following table provides summary statistics for all contract job vacancies requiring database or business intelligence skills in London.

Contract vacancies with a requirement for database or business intelligence skills 2,800 3,842 5,554
As % of all contract IT jobs advertised in London 22.31% 21.55% 20.55%
Number of daily rates quoted 1,981 2,833 4,047
10th Percentile £375 £378 £400
25th Percentile £450 £460 £475
Median daily rate (50th Percentile) £552 £563 £575
Median % change year-on-year -1.87% -2.17% -1.71%
75th Percentile £713 £700 £700
90th Percentile £838 £825 £800
England median daily rate £525 £530 £550
% change year-on-year -0.94% -3.64% -
Number of hourly rates quoted 32 37 53
10th Percentile £22.27 £20.98 £21.24
25th Percentile £28.03 £25.79 £24.50
Median hourly rate £39.31 £50.00 £52.50
Median % change year-on-year -21.39% -4.76% -
75th Percentile £56.50 £55.00 £72.50
90th Percentile £76.50 £64.73 £88.30
England median hourly rate £32.05 £40.13 £58.05
% change year-on-year -20.12% -30.87% +35.25%

SQL Server
Job Vacancy Trend in London

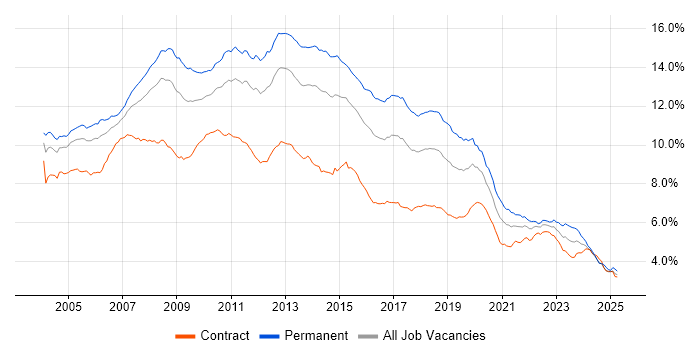
Job postings citing SQL Server as a proportion of all IT jobs advertised in London.

Job vacancy trend for SQL Server in London

SQL Server
Contractor Daily Rate Trend in London

3-month moving average daily rate quoted in jobs citing SQL Server in London.

Daily rate trend for SQL Server in London

SQL Server
Daily Rate Histogram in London

Daily rate distribution for jobs citing SQL Server in London over the 6 months to 1 May 2025.

Daily rate histogram for SQL Server in London

SQL Server
Contractor Hourly Rate Trend in London

3-month moving average hourly rates quoted in jobs citing SQL Server in London.

Hourly rate trend for SQL Server in London

SQL Server
Contract Job Locations in London

The table below looks at the demand and provides a guide to the median contractor rates quoted in IT jobs citing SQL Server within the London region over the 6 months to 1 May 2025. The 'Rank Change' column provides an indication of the change in demand within each location based on the same 6 month period last year.

Location Rank Change
on Same Period
Last Year
Matching
Contract
IT Job Ads
Median
Daily Rate
Past 6 Months
Median Daily Rate
% Change
on Same Period
Last Year
Live
Jobs
Central London -8 89 £585 +15.84% 67
West London +8 6 £652 +45.54% 15
East London 0 5 £400 -22.52% 4
South London +3 3 £725 +52.63% 6
SQL Server
England

SQL Server
Co-occurring Skills and Capabilities in London by Category

The follow tables expand on the table above by listing co-occurrences grouped by category. The same employment type, locality and period is covered with up to 20 co-occurrences shown in each of the following categories:

Application Platforms
1 21 (5.13%) IIS
1 21 (5.13%) SharePoint
2 16 (3.91%) Apache
3 14 (3.42%) Apache Spark
4 12 (2.93%) Microsoft Exchange
5 7 (1.71%) Confluence
6 6 (1.47%) Jupyter
7 3 (0.73%) Oracle Workflow
7 3 (0.73%) Skype for Business
8 2 (0.49%) BizTalk Server
8 2 (0.49%) Oracle SOA Suite
9 1 (0.24%) Apache Airflow
9 1 (0.24%) CMS
9 1 (0.24%) FactoryTalk
9 1 (0.24%) nginx
9 1 (0.24%) SAS
9 1 (0.24%) WebLogic
9 1 (0.24%) WebSphere
Applications
1 48 (11.74%) Microsoft Excel
2 5 (1.22%) Microsoft Office
3 2 (0.49%) MS Visio
3 2 (0.49%) Notepad++
4 1 (0.24%) Spreadsheet
4 1 (0.24%) SPSS
4 1 (0.24%) Stata
Business Applications
1 29 (7.09%) Dynamics CRM
2 4 (0.98%) Cognos Business Intelligence
2 4 (0.98%) Fidessa
3 2 (0.49%) Actimize
3 2 (0.49%) Aladdin
3 2 (0.49%) Alphatax
3 2 (0.49%) Endur
3 2 (0.49%) Markit EDM
4 1 (0.24%) FastStats
4 1 (0.24%) Loan IQ
4 1 (0.24%) NEC Housing
4 1 (0.24%) Payment Gateway
4 1 (0.24%) Salesforce CRM
4 1 (0.24%) SAP S/4HANA
4 1 (0.24%) Sparx Enterprise Architect
Cloud Services
1 178 (43.52%) Azure
2 77 (18.83%) Power Platform
3 52 (12.71%) AWS
4 31 (7.58%) Entra ID
5 30 (7.33%) GitHub
6 28 (6.85%) PowerApps
7 27 (6.60%) Azure Data Factory
8 25 (6.11%) Power Automate
9 24 (5.87%) Azure DevOps
9 24 (5.87%) Microsoft 365
10 23 (5.62%) Azure Service Bus
11 21 (5.13%) Dynamics 365
12 17 (4.16%) Azure Cosmos DB
13 16 (3.91%) GitHub Actions
14 15 (3.67%) Azure AKS
15 14 (3.42%) Azure Logic Apps
16 13 (3.18%) Azure Functions
16 13 (3.18%) Serverless
17 12 (2.93%) SaaS
18 10 (2.44%) GCP
Communications & Networking
1 24 (5.87%) DNS
2 16 (3.91%) Firewall
3 11 (2.69%) Internet
4 9 (2.20%) TCP/IP
5 7 (1.71%) DHCP
5 7 (1.71%) VPN
6 6 (1.47%) SSH
7 4 (0.98%) HTTP
7 4 (0.98%) Network Security
7 4 (0.98%) SAN
7 4 (0.98%) VoIP
8 3 (0.73%) FIX Connectivity
8 3 (0.73%) LAN
8 3 (0.73%) Skype
8 3 (0.73%) WAN
8 3 (0.73%) Wireshark
9 2 (0.49%) Intrusion Detection
9 2 (0.49%) Kerberos
9 2 (0.49%) NAS
9 2 (0.49%) VLAN
Database & Business Intelligence
1 57 (13.94%) Power BI
2 51 (12.47%) SQL Server Reporting Services
3 45 (11.00%) SQL Server Integration Services
4 36 (8.80%) Oracle Database
5 29 (7.09%) Azure SQL Database
5 29 (7.09%) Data Warehouse
6 27 (6.60%) NoSQL
7 26 (6.36%) PostgreSQL
8 25 (6.11%) Relational Database
9 20 (4.89%) MongoDB
10 17 (4.16%) Redis
11 15 (3.67%) Tableau
12 14 (3.42%) MySQL
13 11 (2.69%) Big Data
14 10 (2.44%) BusinessObjects
14 10 (2.44%) DB2
15 9 (2.20%) Apache Hive
15 9 (2.20%) Delta Lake
15 9 (2.20%) Oracle Reports
16 8 (1.96%) MS Access
Development Applications
1 28 (6.85%) Git
2 27 (6.60%) JIRA
3 23 (5.62%) Jenkins
4 13 (3.18%) GitLab
5 12 (2.93%) Bitbucket
6 9 (2.20%) TeamCity
7 7 (1.71%) Octopus Deploy
7 7 (1.71%) SQL Server Management Studio (SSMS)
8 6 (1.47%) RStudio
8 6 (1.47%) SonarQube
9 5 (1.22%) Sonatype Nexus
10 4 (0.98%) QARun
10 4 (0.98%) WinRunner
11 3 (0.73%) ERwin
11 3 (0.73%) JUnit
11 3 (0.73%) Liquibase
11 3 (0.73%) Visual Studio
12 2 (0.49%) Cucumber
12 2 (0.49%) JMeter
12 2 (0.49%) Postman
General
1 140 (34.23%) Finance
2 103 (25.18%) Social Skills
3 86 (21.03%) Banking
4 37 (9.05%) Analytical Skills
5 24 (5.87%) Front Office
5 24 (5.87%) Investment Banking
6 16 (3.91%) Public Sector
7 11 (2.69%) Organisational Skills
8 10 (2.44%) Back Office
9 8 (1.96%) Documentation Skills
10 6 (1.47%) Law
10 6 (1.47%) Retail Banking
11 5 (1.22%) Financial Institution
11 5 (1.22%) Legal
12 3 (0.73%) Local Government
12 3 (0.73%) Marketing
12 3 (0.73%) Police
13 2 (0.49%) Corporate Banking
13 2 (0.49%) Inclusion and Diversity
14 1 (0.24%) General Ledger
Job Titles
1 175 (42.79%) Developer
2 66 (16.14%) C# Developer
3 55 (13.45%) Analyst
4 46 (11.25%) Senior
5 34 (8.31%) .NET Developer
5 34 (8.31%) Architect
6 30 (7.33%) Data Engineer
7 22 (5.38%) Data Analyst
8 20 (4.89%) Senior Developer
9 18 (4.40%) C# .NET Developer
10 17 (4.16%) Azure Engineer
11 16 (3.91%) DBA
11 16 (3.91%) Software Engineer
11 16 (3.91%) SQL DBA
11 16 (3.91%) SQL Developer
12 15 (3.67%) Consultant
13 14 (3.42%) Applications Support
13 14 (3.42%) Full-Stack Developer
13 14 (3.42%) Lead
14 13 (3.18%) WPF Developer
Libraries, Frameworks & Software Standards
1 124 (30.32%) .NET
2 57 (13.94%) .NET Framework
3 39 (9.54%) REST
4 35 (8.56%) HTML
5 33 (8.07%) CSS
6 31 (7.58%) ASP.NET
7 30 (7.33%) WCF
8 29 (7.09%) React
8 29 (7.09%) RESTful
9 26 (6.36%) XML
10 25 (6.11%) .NET Core
10 25 (6.11%) AngularJS
10 25 (6.11%) JSON
10 25 (6.11%) Kafka
10 25 (6.11%) Web Services
11 24 (5.87%) ASP.NET Web API
12 21 (5.13%) OAuth
13 17 (4.16%) WPF
14 16 (3.91%) Entity Framework
15 15 (3.67%) ASP.NET MVC
Miscellaneous
1 27 (6.60%) Derivative
2 17 (4.16%) Legacy Systems
3 15 (3.67%) Distributed Systems
4 14 (3.42%) Public Cloud
5 13 (3.18%) Data Structures
6 12 (2.93%) Clustering
7 11 (2.69%) Data Centre
7 11 (2.69%) Foreign Exchange (FX)
8 10 (2.44%) Reference Data
9 9 (2.20%) Replication
10 8 (1.96%) Linux Command Line
10 8 (1.96%) SWIFT Messaging Network
11 5 (1.22%) Data Protection Act
11 5 (1.22%) Enterprise Software
11 5 (1.22%) Fixed Income
11 5 (1.22%) Greenfield Project
11 5 (1.22%) Management Information System
11 5 (1.22%) Onboarding
11 5 (1.22%) Self-Motivation
12 4 (0.98%) Market Risk
Operating Systems
1 88 (21.52%) Windows
2 51 (12.47%) Linux
3 38 (9.29%) Windows Server
4 17 (4.16%) Unix
5 10 (2.44%) Red Hat Enterprise Linux
6 7 (1.71%) VMS
7 6 (1.47%) CentOS
8 5 (1.22%) Windows 10
9 4 (0.98%) Windows Server 2016
10 3 (0.73%) Solaris
11 2 (0.49%) Android
11 2 (0.49%) Rocky
11 2 (0.49%) Windows Server 2012
11 2 (0.49%) Windows Server 2019
12 1 (0.24%) Apple iOS
12 1 (0.24%) Oracle Linux
12 1 (0.24%) SUSE
12 1 (0.24%) Ubuntu
12 1 (0.24%) Windows 7
12 1 (0.24%) Windows 8
Processes & Methodologies
1 96 (23.47%) Agile
2 78 (19.07%) DevOps
3 72 (17.60%) Problem-Solving
4 54 (13.20%) Migration
5 53 (12.96%) Business Intelligence
6 50 (12.22%) CI/CD
7 47 (11.49%) Test Automation
8 46 (11.25%) Data Analysis
9 42 (10.27%) Software Engineering
10 37 (9.05%) Data Modelling
11 36 (8.80%) CRM
12 34 (8.31%) ETL
13 32 (7.82%) Performance Tuning
13 32 (7.82%) Unit Testing
14 29 (7.09%) Disaster Recovery
14 29 (7.09%) TDD
15 28 (6.85%) Microservices
16 27 (6.60%) Visualisation
17 26 (6.36%) Risk Management
18 25 (6.11%) Scrum
Programming Languages
1 204 (49.88%) SQL
2 167 (40.83%) C#
3 94 (22.98%) Python
4 61 (14.91%) JavaScript
5 41 (10.02%) T-SQL
6 36 (8.80%) Java
7 34 (8.31%) PowerShell
8 28 (6.85%) TypeScript
9 25 (6.11%) PL/SQL
10 22 (5.38%) VB
11 21 (5.13%) VBA
12 16 (3.91%) Bash
13 13 (3.18%) Scala
14 8 (1.96%) Perl
15 7 (1.71%) R
16 6 (1.47%) Shell Script
17 3 (0.73%) Bicep
17 3 (0.73%) C++
18 2 (0.49%) Groovy
18 2 (0.49%) VBScript
Qualifications
1 51 (12.47%) Degree
2 48 (11.74%) Security Cleared
3 38 (9.29%) SC Cleared
4 11 (2.69%) Azure Certification
5 8 (1.96%) DV Cleared
5 8 (1.96%) Microsoft Certification
6 7 (1.71%) Computer Science Degree
7 4 (0.98%) MCPD
7 4 (0.98%) MCSD
8 2 (0.49%) AWS Certification
8 2 (0.49%) ITIL Certification
8 2 (0.49%) PRINCE2 Certification
8 2 (0.49%) VCAP
8 2 (0.49%) VMware Certified Professional (VCP)
9 1 (0.24%) AWS Certified Solutions Architect
9 1 (0.24%) BPSS Clearance
9 1 (0.24%) ISEB
9 1 (0.24%) Master's Degree
9 1 (0.24%) RHCSA
9 1 (0.24%) TOGAF Certification
Quality Assurance & Compliance
1 40 (9.78%) QA
2 22 (5.38%) Data Quality
3 20 (4.89%) GDPR
4 13 (3.18%) Sarbanes-Oxley
5 7 (1.71%) Government Security Classifications
6 6 (1.47%) Accessibility
6 6 (1.47%) EMIR
6 6 (1.47%) MiFID
7 5 (1.22%) ISO/IEC 27001
8 2 (0.49%) Actionable Recommendations
8 2 (0.49%) HMG Security Policy Framework
8 2 (0.49%) SLA
8 2 (0.49%) WCAG
9 1 (0.24%) California Consumer Privacy Act
9 1 (0.24%) HIPAA
9 1 (0.24%) HL7
9 1 (0.24%) ISO 20022
9 1 (0.24%) NIST
9 1 (0.24%) PCI DSS
9 1 (0.24%) SEPA
System Software
1 36 (8.80%) Active Directory
2 29 (7.09%) Docker
3 15 (3.67%) VMware Infrastructure
4 8 (1.96%) Virtual Machines
5 4 (0.98%) Hyper-V
5 4 (0.98%) VMware ESXi
5 4 (0.98%) vSphere
6 3 (0.73%) KVM
6 3 (0.73%) vCloud
6 3 (0.73%) Virtual Desktop
6 3 (0.73%) VMware Workstation
7 1 (0.24%) Oracle RAC
Systems Management
1 40 (9.78%) Kubernetes
2 31 (7.58%) Terraform
3 13 (3.18%) Ansible
4 3 (0.73%) Kibana
4 3 (0.73%) Microsoft Intune
4 3 (0.73%) Rundeck
4 3 (0.73%) SCCM
4 3 (0.73%) ZABBIX
5 2 (0.49%) Active Directory Federation Services
5 2 (0.49%) EMC NetWorker
5 2 (0.49%) FortiGate
5 2 (0.49%) Grafana
5 2 (0.49%) Oracle Enterprise Manager
5 2 (0.49%) Prometheus
5 2 (0.49%) Tivoli
5 2 (0.49%) Tivoli Storage Manager
6 1 (0.24%) Enterprise Manager Cloud Control
6 1 (0.24%) Puppet
6 1 (0.24%) QRadar
6 1 (0.24%) Single Sign-On
Vendors
1 121 (29.58%) Microsoft
2 115 (28.12%) Oracle
3 27 (6.60%) Databricks
4 21 (5.13%) VMware
5 17 (4.16%) ServiceNow
6 15 (3.67%) Cisco
6 15 (3.67%) Citrix
7 13 (3.18%) Sybase
8 8 (1.96%) IBM
8 8 (1.96%) Informatica
8 8 (1.96%) SAP
9 7 (1.71%) Red Hat
9 7 (1.71%) TIBCO
10 6 (1.47%) UiPath
11 5 (1.22%) Google
11 5 (1.22%) ION Trading
11 5 (1.22%) Salesforce
12 4 (0.98%) CODA
12 4 (0.98%) Cognos
12 4 (0.98%) Reuters