Onboarding Contracts in London

Onboarding
England > London

The table below looks at the prevalence of the term Onboarding in contract job vacancies in London. Included is a benchmarking guide to the contractor rates offered in vacancies that cited Onboarding over the 6 months leading up to 1 May 2025, comparing them to the same period in the previous two years.

6 months to
1 May 2025
Same period 2024 Same period 2023
Rank 101 141 143
Rank change year-on-year +40 +2 +65
Contract jobs citing Onboarding 346 306 503
As % of all contract jobs advertised in London 2.76% 1.72% 1.86%
As % of the Miscellaneous category 7.66% 5.18% 5.19%
Number of daily rates quoted 234 226 338
10th Percentile £310 £255 £375
25th Percentile £413 £416 £500
Median daily rate (50th Percentile) £538 £525 £575
Median % change year-on-year +2.38% -8.70% -
75th Percentile £638 £623 £675
90th Percentile £788 £768 £766
England median daily rate £513 £525 £553
% change year-on-year -2.24% -5.06% +0.55%
Number of hourly rates quoted 4 4 10
10th Percentile £21.70 £22.88 £24.11
25th Percentile £29.13 £23.44 £27.69
Median hourly rate £34.50 £25.50 £39.50
Median % change year-on-year +35.29% -35.44% +49.06%
75th Percentile £41.19 £35.00 £44.00
90th Percentile £50.98 £48.50 £51.63
England median hourly rate £19.45 £22.98 £39.50
% change year-on-year -15.36% -41.84% +97.50%

All Generic Skills
London

Onboarding falls under the General and Transferable Skills category. For comparison with the information above, the following table provides summary statistics for all contract job vacancies requiring generic IT skills in London.

Contract vacancies with a requirement for generic IT skills 4,516 5,909 9,701
As % of all contract IT jobs advertised in London 35.99% 33.14% 35.89%
Number of daily rates quoted 3,054 4,182 6,966
10th Percentile £325 £301 £375
25th Percentile £451 £450 £500
Median daily rate (50th Percentile) £575 £583 £600
Median % change year-on-year -1.29% -2.92% -
75th Percentile £738 £725 £750
90th Percentile £850 £850 £838
England median daily rate £548 £550 £575
% change year-on-year -0.36% -4.35% +4.55%
Number of hourly rates quoted 74 160 109
10th Percentile £15.84 £15.50 £18.93
25th Percentile £22.60 £18.93 £21.24
Median hourly rate £34.50 £26.00 £35.00
Median % change year-on-year +32.69% -25.71% -21.35%
75th Percentile £50.31 £47.81 £64.50
90th Percentile £80.05 £66.78 £83.15
England median hourly rate £33.00 £30.16 £22.50
% change year-on-year +9.42% +34.04% -16.67%

Onboarding
Job Vacancy Trend in London

Job postings citing Onboarding as a proportion of all IT jobs advertised in London.
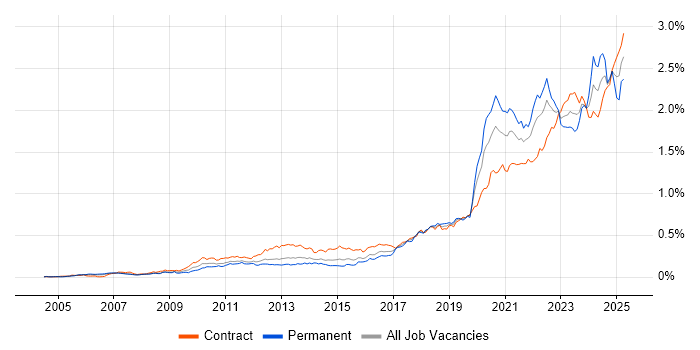
Job vacancy trend for Onboarding in London

Onboarding
Contractor Daily Rate Trend in London

3-month moving average daily rate quoted in jobs citing Onboarding in London.

Daily rate trend for Onboarding in London

Onboarding
Daily Rate Histogram in London

Daily rate distribution for jobs citing Onboarding in London over the 6 months to 1 May 2025.

Daily rate histogram for Onboarding in London

Onboarding
Contractor Hourly Rate Trend in London

3-month moving average hourly rates quoted in jobs citing Onboarding in London.

Hourly rate trend for Onboarding in London

Onboarding
Hourly Rate Histogram in London

Hourly rate distribution of jobs citing Onboarding in London over the 6 months to 1 May 2025.

Hourly rate histogram for Onboarding in London

Onboarding
Contract Job Locations in London

The table below looks at the demand and provides a guide to the median contractor rates quoted in IT jobs citing Onboarding within the London region over the 6 months to 1 May 2025. The 'Rank Change' column provides an indication of the change in demand within each location based on the same 6 month period last year.

Location Rank Change
on Same Period
Last Year
Matching
Contract
IT Job Ads
Median
Daily Rate
Past 6 Months
Median Daily Rate
% Change
on Same Period
Last Year
Live
Jobs
Central London +17 42 £500 -2.44% 52
South London +13 12 £638 +15.91% 1
West London +12 1 - - 24
East London +8 1 £630 +18.53% 6
North London -4 1 £714 +67.88% 2
Onboarding
England

Onboarding
Co-occurring Skills and Capabilities in London by Category

The follow tables expand on the table above by listing co-occurrences grouped by category. The same employment type, locality and period is covered with up to 20 co-occurrences shown in each of the following categories:

Application Platforms
1 19 (5.49%) SharePoint
2 13 (3.76%) Microsoft Exchange
3 10 (2.89%) Confluence
4 5 (1.45%) Oracle Workflow
5 3 (0.87%) Skype for Business
6 2 (0.58%) Adobe Experience Manager
6 2 (0.58%) Apache Airflow
6 2 (0.58%) CMS
6 2 (0.58%) Drupal
6 2 (0.58%) nginx
6 2 (0.58%) Umbraco
7 1 (0.29%) Anypoint
7 1 (0.29%) Apache
7 1 (0.29%) Exchange Server 2010
7 1 (0.29%) MS Project Server
7 1 (0.29%) Mule ESB
7 1 (0.29%) Tomcat
Applications
1 17 (4.91%) Microsoft Office
2 14 (4.05%) Microsoft Excel
3 6 (1.73%) Microsoft PowerPoint
4 5 (1.45%) Microsoft Project
5 2 (0.58%) MS Visio
6 1 (0.29%) AutoCAD
6 1 (0.29%) Sketch
6 1 (0.29%) Trello
Business Applications
1 14 (4.05%) Aladdin
1 14 (4.05%) thinkFolio
2 7 (2.02%) Dynamics CRM
3 2 (0.58%) CiviCRM
3 2 (0.58%) SAP HCM
3 2 (0.58%) SAP WM
4 1 (0.29%) Fidessa
4 1 (0.29%) Remedy ITSM
4 1 (0.29%) SAP MDG
4 1 (0.29%) SAP MM
4 1 (0.29%) SAP S/4HANA
4 1 (0.29%) SAP SRM
4 1 (0.29%) Workday HCM
Cloud Services
1 50 (14.45%) Azure
2 46 (13.29%) AWS
3 35 (10.12%) Microsoft 365
4 20 (5.78%) Entra ID
5 17 (4.91%) Power Platform
5 17 (4.91%) SaaS
6 12 (3.47%) Asana
6 12 (3.47%) SuccessFactors
7 11 (3.18%) Slack
8 9 (2.60%) OneDrive
9 8 (2.31%) Dynamics 365
9 8 (2.31%) GitHub
10 7 (2.02%) Amazon S3
10 7 (2.02%) Serverless
11 6 (1.73%) Microsoft Purview
11 6 (1.73%) OCI
12 4 (1.16%) Azure DevOps
12 4 (1.16%) PaaS
12 4 (1.16%) Salesforce Service Cloud
12 4 (1.16%) WhatsApp
Communications & Networking
1 10 (2.89%) SSL
1 10 (2.89%) VPN
2 9 (2.60%) Firewall
3 5 (1.45%) HTTPS
3 5 (1.45%) Wi-Fi
4 4 (1.16%) Remote Desktop
4 4 (1.16%) SSH
5 3 (0.87%) LAN
5 3 (0.87%) Skype
5 3 (0.87%) TCP/IP
5 3 (0.87%) WAN
6 2 (0.58%) DNS
6 2 (0.58%) Network Security
6 2 (0.58%) VoIP
6 2 (0.58%) Wireshark
7 1 (0.29%) Cisco IOS
7 1 (0.29%) DHCP
7 1 (0.29%) SMTP
7 1 (0.29%) SWIFTNet
7 1 (0.29%) VLAN
Database & Business Intelligence
1 17 (4.91%) Power BI
2 6 (1.73%) Tableau
3 5 (1.45%) Metadata
3 5 (1.45%) SQL Server
3 5 (1.45%) SQL Server Reporting Services
4 4 (1.16%) Amazon Redshift
5 3 (0.87%) NoSQL
6 2 (0.58%) Amazon Aurora
6 2 (0.58%) Amazon RDS
6 2 (0.58%) Data Lake
6 2 (0.58%) Data Warehouse
6 2 (0.58%) Elasticsearch
6 2 (0.58%) MongoDB
6 2 (0.58%) PostgreSQL
6 2 (0.58%) Power Query
6 2 (0.58%) RDBMS
6 2 (0.58%) Redis
6 2 (0.58%) Relational Database
7 1 (0.29%) Amazon Athena
7 1 (0.29%) Data Hub
Development Applications
1 26 (7.51%) JIRA
2 18 (5.20%) GitLab
3 10 (2.89%) Jenkins
4 8 (2.31%) Git
5 5 (1.45%) Postman
6 4 (1.16%) Selenium
7 3 (0.87%) Atlassian Bamboo
8 2 (0.58%) Cucumber
8 2 (0.58%) Cypress.io
8 2 (0.58%) MLflow
8 2 (0.58%) TeamCity
8 2 (0.58%) Visual Studio
9 1 (0.29%) Artifactory
9 1 (0.29%) REST Assured
9 1 (0.29%) SoapUI
9 1 (0.29%) Subversion
9 1 (0.29%) Visual Studio Code
9 1 (0.29%) WebDriver
General
1 113 (32.66%) Social Skills
2 104 (30.06%) Finance
3 51 (14.74%) Public Sector
4 43 (12.43%) Analytical Skills
5 37 (10.69%) Banking
6 27 (7.80%) Front Office
7 24 (6.94%) Marketing
8 17 (4.91%) Investment Banking
9 15 (4.34%) Retail
10 14 (4.05%) Telecoms
11 11 (3.18%) Documentation Skills
12 10 (2.89%) Legal
13 9 (2.60%) Manufacturing
13 9 (2.60%) Retail Banking
14 8 (2.31%) Electronics
14 8 (2.31%) Inclusion and Diversity
14 8 (2.31%) Presentation Skills
15 7 (2.02%) Corporate Banking
15 7 (2.02%) Influencing Skills
15 7 (2.02%) Organisational Skills
Job Titles
1 60 (17.34%) Analyst
2 38 (10.98%) Architect
3 35 (10.12%) Developer
4 33 (9.54%) Business Analyst
5 29 (8.38%) Consultant
6 23 (6.65%) Senior
7 21 (6.07%) Lead
8 17 (4.91%) Business Manager
8 17 (4.91%) Fixed Income Business Analyst
8 17 (4.91%) IT Support
8 17 (4.91%) Support Engineer
9 14 (4.05%) IT Engineer
9 14 (4.05%) IT Support Engineer
9 14 (4.05%) Project Manager
10 13 (3.76%) Delivery Manager
11 12 (3.47%) DevOps Engineer
12 9 (2.60%) AWS Engineer
12 9 (2.60%) Azure Engineer
12 9 (2.60%) Microsoft 365 Engineer
13 8 (2.31%) AWS Architect
Libraries, Frameworks & Software Standards
1 9 (2.60%) .NET
2 8 (2.31%) REST
3 7 (2.02%) SailPoint
3 7 (2.02%) SAML
4 6 (1.73%) Oracle Fusion
4 6 (1.73%) SOAP
4 6 (1.73%) Web Services
5 5 (1.45%) JSON
5 5 (1.45%) LDAP
5 5 (1.45%) React
6 4 (1.16%) CSS
6 4 (1.16%) HTML
6 4 (1.16%) JDBC
6 4 (1.16%) ODBC
6 4 (1.16%) XML
7 3 (0.87%) AWS CDK
7 3 (0.87%) Redux
7 3 (0.87%) RESTful
8 2 (0.58%) AngularJS
8 2 (0.58%) Swagger
Miscellaneous
1 22 (6.36%) Fixed Income
2 21 (6.07%) Derivative
3 18 (5.20%) Hedge funds
4 13 (3.76%) Legacy Systems
5 7 (2.02%) Management Information System
5 7 (2.02%) Product Ownership
5 7 (2.02%) Social Media
6 6 (1.73%) BYOD
6 6 (1.73%) Data Protection Act
6 6 (1.73%) Equities
7 5 (1.45%) Self-Motivation
7 5 (1.45%) Video Conferencing
8 4 (1.16%) Cloud Native
8 4 (1.16%) e-Learning
8 4 (1.16%) Legacy Applications
9 3 (0.87%) Greenfield Project
9 3 (0.87%) Grid Computing
10 2 (0.58%) Blackberry
10 2 (0.58%) FMCG
10 2 (0.58%) Learning Management System
Operating Systems
1 32 (9.25%) Windows
2 10 (2.89%) Unix
3 7 (2.02%) Windows 10
4 6 (1.73%) Android
4 6 (1.73%) Apple iOS
4 6 (1.73%) Linux
5 5 (1.45%) Windows Server
6 2 (0.58%) Mac OS
7 1 (0.29%) Red Hat Enterprise Linux
Processes & Methodologies
1 63 (18.21%) Agile
2 56 (16.18%) Problem-Solving
3 48 (13.87%) Project Management
4 36 (10.40%) DevOps
5 33 (9.54%) Asset Management
5 33 (9.54%) Business Analysis
5 33 (9.54%) Stakeholder Management
6 32 (9.25%) Analytics
6 32 (9.25%) Business Intelligence
7 30 (8.67%) Client Onboarding
8 26 (7.51%) Investment Management
9 23 (6.65%) Roadmaps
10 22 (6.36%) Migration
11 21 (6.07%) Service Management
12 20 (5.78%) Portfolio Management
13 19 (5.49%) CI/CD
13 19 (5.49%) Cybersecurity
13 19 (5.49%) Data Mapping
14 17 (4.91%) Artificial Intelligence
14 17 (4.91%) Stakeholder Engagement
Programming Languages
1 42 (12.14%) SQL
2 37 (10.69%) Python
3 18 (5.20%) Java
4 10 (2.89%) PowerShell
5 8 (2.31%) TypeScript
6 7 (2.02%) JavaScript
7 6 (1.73%) C#
8 4 (1.16%) ActionScript
8 4 (1.16%) ActionScript 2.0
9 3 (0.87%) Bash
9 3 (0.87%) PHP
9 3 (0.87%) PL/SQL
10 2 (0.58%) C
11 1 (0.29%) Apex Code
11 1 (0.29%) Kusto Query Language
11 1 (0.29%) Ruby
11 1 (0.29%) Search Processing Language
11 1 (0.29%) T-SQL
Qualifications
1 64 (18.50%) Security Cleared
2 50 (14.45%) SC Cleared
3 19 (5.49%) Degree
4 10 (2.89%) BPSS Clearance
5 8 (2.31%) PMI Certification
6 7 (2.02%) PMP
7 6 (1.73%) Azure Certification
8 5 (1.45%) AWS Certification
9 4 (1.16%) CISSP
9 4 (1.16%) DV Cleared
10 3 (0.87%) Cisco Certification
11 2 (0.58%) (ISC)2 CCSP
11 2 (0.58%) CCSP
11 2 (0.58%) CISA
11 2 (0.58%) CISM
11 2 (0.58%) Master's Degree
11 2 (0.58%) SAP Certification
12 1 (0.29%) Computer Science Degree
12 1 (0.29%) SANS
12 1 (0.29%) TOGAF Certification
Quality Assurance & Compliance
1 13 (3.76%) PMO
2 11 (3.18%) GDPR
3 9 (2.60%) QA
4 8 (2.31%) Data Quality
5 5 (1.45%) Accessibility
5 5 (1.45%) ISO/IEC 27001
5 5 (1.45%) Sarbanes-Oxley
5 5 (1.45%) SLA
6 4 (1.16%) GRC
6 4 (1.16%) HIPAA
7 3 (0.87%) NIST
8 2 (0.58%) EMIR
8 2 (0.58%) MiFID
8 2 (0.58%) PCI DSS
9 1 (0.29%) Basel II
9 1 (0.29%) DICOM
9 1 (0.29%) HL7
9 1 (0.29%) ISO 20022
9 1 (0.29%) ISO/IEC 27002 (supersedes ISO/IEC 17799)
9 1 (0.29%) WCAG
System Software
1 26 (7.51%) Active Directory
2 8 (2.31%) Docker
3 3 (0.87%) VMware ESXi
4 2 (0.58%) Virtual Machines
4 2 (0.58%) XenDesktop
5 1 (0.29%) Firmware
5 1 (0.29%) Oracle RAC
5 1 (0.29%) Veritas Cluster Server
5 1 (0.29%) VMware Infrastructure
Systems Management
1 14 (4.05%) Terraform
2 12 (3.47%) Kubernetes
3 11 (3.18%) Microsoft Intune
4 7 (2.02%) Single Sign-On
5 6 (1.73%) Ansible
5 6 (1.73%) Grafana
6 5 (1.45%) Prometheus
7 4 (1.16%) Active Directory Federation Services
8 3 (0.87%) Forefront Identity Manager
8 3 (0.87%) ITRS Geneos
8 3 (0.87%) SCCM
9 2 (0.58%) CASB
9 2 (0.58%) Rundeck
10 1 (0.29%) Argo
10 1 (0.29%) Data Guard
10 1 (0.29%) Jamf Pro
10 1 (0.29%) McAfee ePO
10 1 (0.29%) Plesk
10 1 (0.29%) QRadar
10 1 (0.29%) VxRail
Vendors
1 61 (17.63%) Microsoft
2 42 (12.14%) Virgin Media
3 27 (7.80%) SAP
4 17 (4.91%) Charles River
4 17 (4.91%) ServiceNow
5 15 (4.34%) Oracle
5 15 (4.34%) Salesforce
6 14 (4.05%) BISAM
6 14 (4.05%) Calypso
6 14 (4.05%) SimCorp
6 14 (4.05%) Splunk
7 9 (2.60%) Zscaler
8 8 (2.31%) Palo Alto
9 6 (1.73%) Cisco
10 5 (1.45%) Google
10 5 (1.45%) IBM
10 5 (1.45%) MuleSoft
10 5 (1.45%) Qualtrics
11 4 (1.16%) DocuSign
11 4 (1.16%) Workday