Splunk Contract Job Trends in London

Splunk
England > London

The table below provides summary statistics for contract job vacancies advertised in London requiring knowledge or experience of Splunk products and/or services. It includes a benchmarking guide to contractor rates offered in vacancies that cited Splunk over the 6 months leading up to 7 November 2025, comparing them to the same period in the previous two years.

The figures below represent the IT contractor job market in general and are not representative of contractor rates within Splunk, Inc.

6 months to
7 Nov 2025
Same period 2024 Same period 2023
Rank 163 184 162
Rank change year-on-year +21 -22 +37
Contract jobs citing Splunk 245 216 303
As % of all contract jobs in London 1.76% 1.38% 1.50%
As % of the Vendors category 3.79% 3.15% 3.65%
Number of daily rates quoted 145 126 250
10th Percentile £413 £413 £412
25th Percentile £475 £488 £500
Median daily rate (50th Percentile) £575 £600 £600
Median % change year-on-year -4.17% - -
75th Percentile £650 £775 £798
90th Percentile £775 £810 £810
England median daily rate £530 £568 £600
% change year-on-year -6.61% -5.42% -
Number of hourly rates quoted 2 0 0
10th Percentile £81.63 - -
25th Percentile £82.19 - -
Median hourly rate £88.75 - -
75th Percentile £94.69 - -
90th Percentile £94.88 - -
England median hourly rate £88.75 £60.00 -
% change year-on-year +47.92% - -

All Vendors
London

Splunk falls under the Vendor Products and Services category. For comparison with the information above, the following table provides summary statistics for all contract job vacancies requiring knowledge or experience of all vendor products and services in London.

Contract vacancies with a requirement for knowledge or experience of vendor products and services 6,458 6,862 8,307
As % of all contract IT jobs advertised in London 46.43% 43.69% 41.09%
Number of daily rates quoted 4,171 4,310 5,777
10th Percentile £325 £313 £305
25th Percentile £420 £425 £430
Median daily rate (50th Percentile) £525 £535 £550
Median % change year-on-year -1.87% -2.73% -4.35%
75th Percentile £650 £638 £675
90th Percentile £738 £750 £775
England median daily rate £506 £525 £525
% change year-on-year -3.62% - -2.33%
Number of hourly rates quoted 135 61 114
10th Percentile £17.50 £20.50 £17.00
25th Percentile £22.50 £25.75 £22.56
Median hourly rate £25.15 £39.50 £40.50
Median % change year-on-year -36.33% -2.47% +60.40%
75th Percentile £38.13 £66.00 £60.00
90th Percentile £63.55 £100.00 £85.35
England median hourly rate £25.00 £35.00 £44.50
% change year-on-year -28.57% -21.35% +73.08%

Splunk
Job Vacancy Trend in London

Historical trend showing the proportion of contract IT job postings citing Splunk relative to all contract IT jobs advertised in London.
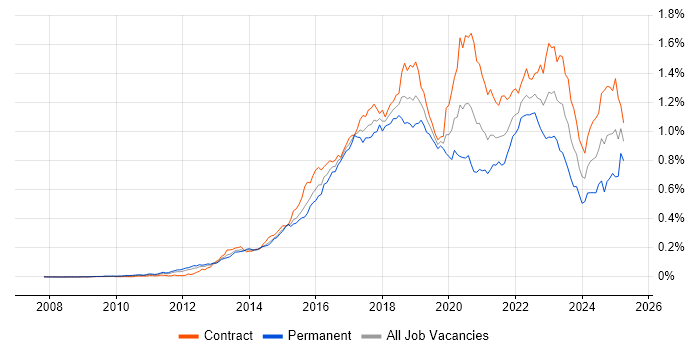
Splunk job vacancy trend in London

Splunk
Daily Rate Trend in London

Contractor daily rate distribution trend for jobs in London citing Splunk.

Contractor daily rate distribution trend for jobs in London citing Splunk

Splunk
Daily Rate Histogram in London

Daily rate distribution for jobs citing Splunk in London over the 6 months to 7 November 2025.

Daily rate histogram for Splunk in London

Splunk
Hourly Rate Trend in London

Contractor hourly rate distribution trend for jobs in London citing Splunk.

Contractor hourly rate distribution trend for jobs in London citing Splunk

Splunk
Contract Job Locations in London

The table below looks at the demand and provides a guide to the median contractor rates quoted in IT jobs citing Splunk within the London region over the 6 months to 7 November 2025. The 'Rank Change' column provides an indication of the change in demand within each location based on the same 6 month period last year.

Location Rank Change
on Same Period
Last Year
Matching
Contract
IT Job Ads
Median
Daily Rate
Past 6 Months
Median Daily Rate
% Change
on Same Period
Last Year
Live
Jobs
Central London +6 27 £495 -12.58% 46
South London +14 21 £425 -39.29% 2
West London -11 4 £415 -5.14% 1
Splunk
England

Splunk
Co-Occurring Skills & Capabilities in London by Category

The following tables expand on the one above by listing co-occurrences grouped by category. They cover the same employment type, locality and period, with up to 20 co-occurrences shown in each category:

Application Platforms
1 9 (3.67%) Confluence
2 8 (3.27%) SharePoint
3 7 (2.86%) Mattermost
3 7 (2.86%) Skype for Business
4 5 (2.04%) Apache
5 3 (1.22%) Tomcat
6 2 (0.82%) Microsoft Exchange
6 2 (0.82%) Oracle HTTP Server
6 2 (0.82%) WebLogic
7 1 (0.41%) Apache Pig
7 1 (0.41%) Apache Spark
7 1 (0.41%) CICS
7 1 (0.41%) MQSeries
7 1 (0.41%) WebSphere
7 1 (0.41%) WebSphere Application Server
Applications
1 8 (3.27%) Microsoft Office
2 2 (0.82%) Microsoft Excel
Business Applications
1 10 (4.08%) Remedy ITSM
2 1 (0.41%) RMDS
Cloud Services
1 93 (37.96%) AWS
2 64 (26.12%) Azure
3 39 (15.92%) GCP
4 31 (12.65%) Azure Sentinel
5 26 (10.61%) Amazon S3
5 26 (10.61%) GitHub
6 25 (10.20%) Amazon EC2
7 21 (8.57%) SaaS
8 19 (7.76%) Amazon SQS
9 12 (4.90%) OpenShift
10 8 (3.27%) Amazon CloudWatch
10 8 (3.27%) OneDrive
11 6 (2.45%) Amazon EKS
11 6 (2.45%) Apigee
11 6 (2.45%) Stackdriver
12 5 (2.04%) Datadog
12 5 (2.04%) Entra ID
12 5 (2.04%) GitHub Actions
12 5 (2.04%) Google Kubernetes Engine
12 5 (2.04%) Sentry
Communications & Networking
1 31 (12.65%) Firewall
2 18 (7.35%) DNS
2 18 (7.35%) Network Security
3 13 (5.31%) SSL
4 11 (4.49%) TCP/IP
5 8 (3.27%) HTTP
6 7 (2.86%) Skype
6 7 (2.86%) Unified Communications
6 7 (2.86%) VPN
6 7 (2.86%) Wireshark
7 4 (1.63%) BGP
8 3 (1.22%) OSPF
8 3 (1.22%) Wireless
9 2 (0.82%) Internet
9 2 (0.82%) SNMP
9 2 (0.82%) SSH
10 1 (0.41%) DHCP
10 1 (0.41%) LAN
10 1 (0.41%) SMS
10 1 (0.41%) VoIP
Database & Business Intelligence
1 14 (5.71%) PostgreSQL
2 12 (4.90%) Redis
3 8 (3.27%) Oracle Database
4 5 (2.04%) BigQuery
4 5 (2.04%) MongoDB
5 4 (1.63%) MySQL
5 4 (1.63%) NoSQL
5 4 (1.63%) SQL Server
6 2 (0.82%) Amazon RDS
6 2 (0.82%) DB2
6 2 (0.82%) Power BI
6 2 (0.82%) Tableau
7 1 (0.41%) Apache Cassandra
7 1 (0.41%) Apache Hive
7 1 (0.41%) Big Data
7 1 (0.41%) Flink
7 1 (0.41%) Hadoop
7 1 (0.41%) KNIME
7 1 (0.41%) Relational Database
Development Applications
1 26 (10.61%) Jenkins
2 22 (8.98%) Git
3 17 (6.94%) GitLab
4 16 (6.53%) JIRA
5 14 (5.71%) Postman
6 11 (4.49%) JUnit
6 11 (4.49%) Subversion
7 10 (4.08%) Maven
8 9 (3.67%) Bitbucket
9 8 (3.27%) SonarQube
10 7 (2.86%) Mockito
11 6 (2.45%) Atlassian Bamboo
11 6 (2.45%) REST Assured
11 6 (2.45%) SoapUI
11 6 (2.45%) Xcode
11 6 (2.45%) XCTest
12 5 (2.04%) Charles Proxy
12 5 (2.04%) Cypress.io
12 5 (2.04%) Katalon Studio
12 5 (2.04%) XCUITest
General
1 75 (30.61%) Social Skills
2 61 (24.90%) Finance
3 34 (13.88%) Analytical Skills
4 26 (10.61%) Banking
5 25 (10.20%) Public Sector
6 18 (7.35%) Documentation Skills
7 9 (3.67%) Financial Institution
8 7 (2.86%) Military
9 6 (2.45%) Retail
10 5 (2.04%) Investment Banking
10 5 (2.04%) Telecoms
11 4 (1.63%) Local Government
11 4 (1.63%) Presentation Skills
12 2 (0.82%) Inclusion and Diversity
12 2 (0.82%) Legal
12 2 (0.82%) Marketing
13 1 (0.41%) Billing
13 1 (0.41%) Front Office
13 1 (0.41%) Law
Job Titles
1 60 (24.49%) Analyst
2 43 (17.55%) Architect
3 33 (13.47%) Security Architect
4 30 (12.24%) Senior
5 26 (10.61%) SOC Analyst
6 25 (10.20%) Security Analyst
6 25 (10.20%) Security Engineer
7 19 (7.76%) Site Reliability Engineer
8 18 (7.35%) Developer
8 18 (7.35%) Monitoring Analyst
9 16 (6.53%) Site Engineer
10 15 (6.12%) DevOps Engineer
10 15 (6.12%) Operations Analyst
11 14 (5.71%) Support Analyst
12 11 (4.49%) Cybersecurity Analyst
13 9 (3.67%) Consultant
14 8 (3.27%) Operational Support Analyst
14 8 (3.27%) Operations Support Analyst
14 8 (3.27%) Senior Analyst
14 8 (3.27%) SharePoint Support
Libraries, Frameworks & Software Standards
1 19 (7.76%) Kafka
2 18 (7.35%) REST
3 16 (6.53%) Web Services
4 9 (3.67%) Node.js
4 9 (3.67%) Spring
4 9 (3.67%) Spring Boot
4 9 (3.67%) Swagger
5 8 (3.27%) AngularJS
6 7 (2.86%) HTML
6 7 (2.86%) SOAP
6 7 (2.86%) Spring Cloud
7 6 (2.45%) Bootstrap
7 6 (2.45%) CSS
7 6 (2.45%) CSS3
7 6 (2.45%) Hibernate
7 6 (2.45%) HTML5
7 6 (2.45%) J2EE
7 6 (2.45%) JPA
7 6 (2.45%) Material-UI
7 6 (2.45%) Spring MVC
Miscellaneous
1 36 (14.69%) Onboarding
2 28 (11.43%) Security Operations Centre
3 20 (8.16%) CSOC
4 14 (5.71%) Cyber Defence
5 11 (4.49%) Cloud Native
6 10 (4.08%) Data Protection Act
6 10 (4.08%) Security Posture
7 9 (3.67%) Distributed Systems
8 8 (3.27%) Clustering
8 8 (3.27%) Cyber Threat
9 6 (2.45%) Algorithms
9 6 (2.45%) Management Information System
9 6 (2.45%) PKI
10 5 (2.04%) Data Centre
10 5 (2.04%) Foreign Exchange (FX)
10 5 (2.04%) Mobile App
11 4 (1.63%) Linux Command Line
11 4 (1.63%) Replication
12 3 (1.22%) IVR
12 3 (1.22%) Private Cloud
Operating Systems
1 46 (18.78%) Linux
2 20 (8.16%) Windows
3 17 (6.94%) Unix
4 11 (4.49%) Red Hat Enterprise Linux
5 6 (2.45%) Apple iOS
6 5 (2.04%) Android
7 4 (1.63%) Solaris
7 4 (1.63%) Ubuntu
8 3 (1.22%) CentOS
8 3 (1.22%) Mac OS
9 2 (0.82%) VMS
9 2 (0.82%) Windows Server
Processes & Methodologies
1 83 (33.88%) SIEM
2 78 (31.84%) Cybersecurity
3 69 (28.16%) Problem-Solving
4 61 (24.90%) Incident Response
5 58 (23.67%) DevOps
6 55 (22.45%) CI/CD
6 55 (22.45%) Security Operations
7 41 (16.73%) Agile
8 40 (16.33%) SOAR
9 37 (15.10%) Observability
10 35 (14.29%) Threat Detection
11 33 (13.47%) Use Case
12 30 (12.24%) Containerisation
12 30 (12.24%) Infrastructure as Code
12 30 (12.24%) MITRE ATT&CK
13 26 (10.61%) Information Security
14 25 (10.20%) Continuous Improvement
15 24 (9.80%) Mentoring
15 24 (9.80%) Microservices
16 23 (9.39%) ITIL
Programming Languages
1 66 (26.94%) Python
2 46 (18.78%) SQL
3 45 (18.37%) Bash
4 34 (13.88%) PowerShell
5 18 (7.35%) Go
5 18 (7.35%) Java
5 18 (7.35%) Kusto Query Language
6 14 (5.71%) PromQL
7 12 (4.90%) JavaScript
7 12 (4.90%) Shell Script
8 7 (2.86%) Perl
9 6 (2.45%) Groovy
10 5 (2.04%) Kotlin
10 5 (2.04%) Swift
11 3 (1.22%) C++
12 2 (0.82%) Apex Code
12 2 (0.82%) Search Processing Language
13 1 (0.41%) Bicep
13 1 (0.41%) R
13 1 (0.41%) Scala
Qualifications
1 60 (24.49%) Security Cleared
2 42 (17.14%) SC Cleared
3 27 (11.02%) CISSP
4 20 (8.16%) Degree
5 16 (6.53%) CISM
6 12 (4.90%) CEH
7 11 (4.49%) ITIL Certification
8 10 (4.08%) DV Cleared
9 9 (3.67%) CompTIA Security+
10 8 (3.27%) GIAC
10 8 (3.27%) Master's Degree
11 7 (2.86%) CISA
12 6 (2.45%) AWS Certification
12 6 (2.45%) Computer Science Degree
13 4 (1.63%) ISO 27001 Lead Auditor
14 3 (1.22%) AWS Certified Solutions Architect
14 3 (1.22%) GCIA
14 3 (1.22%) GCIH
14 3 (1.22%) SSCP
15 2 (0.82%) Microsoft Certification
Quality Assurance & Compliance
1 12 (4.90%) GDPR
1 12 (4.90%) NIST
2 11 (4.49%) ISO/IEC 27001
3 10 (4.08%) QA
4 6 (2.45%) Cyber Essentials
5 5 (2.04%) Accessibility
6 4 (1.63%) PCI DSS
6 4 (1.63%) Sarbanes-Oxley
6 4 (1.63%) SLA
7 2 (0.82%) Cyber Essentials PLUS
7 2 (0.82%) FIPS 140-2
8 1 (0.41%) Data Quality
8 1 (0.41%) NCSC
8 1 (0.41%) NIST 800
8 1 (0.41%) SOC 2
System Software
1 42 (17.14%) Docker
2 24 (9.80%) Active Directory
3 5 (2.04%) Snort
3 5 (2.04%) VMware Infrastructure
4 4 (1.63%) NFS
4 4 (1.63%) Squid
4 4 (1.63%) Veritas File System
4 4 (1.63%) Veritas Volume Manager
4 4 (1.63%) VMware ESXi
5 2 (0.82%) VMware NSX
6 1 (0.41%) Virtual Machines
6 1 (0.41%) vSphere
Systems Management
1 62 (25.31%) Kubernetes
2 35 (14.29%) Grafana
3 31 (12.65%) Prometheus
4 29 (11.84%) Ansible
5 27 (11.02%) Terraform
6 17 (6.94%) SCOM
7 14 (5.71%) HP SiteScope
7 14 (5.71%) QRadar
8 6 (2.45%) Nessus
8 6 (2.45%) Single Sign-On
9 5 (2.04%) Argo
9 5 (2.04%) CSIRT
9 5 (2.04%) Puppet
10 4 (1.63%) Nexpose
10 4 (1.63%) Red Hat Satellite
10 4 (1.63%) Suricata
11 3 (1.22%) Istio
11 3 (1.22%) Nagios
12 2 (0.82%) Kustomize
13 1 (0.41%) VxRail
Vendors
1 64 (26.12%) Microsoft
2 31 (12.65%) CrowdStrike
3 30 (12.24%) Qualys
4 20 (8.16%) Carbon Black
4 20 (8.16%) Dynatrace
5 18 (7.35%) Google
5 18 (7.35%) Oracle
6 15 (6.12%) CyberArk
7 14 (5.71%) Cisco
8 12 (4.90%) Palo Alto
8 12 (4.90%) ServiceNow
9 11 (4.49%) Red Hat
9 11 (4.49%) Remedy
9 11 (4.49%) Tenable
10 10 (4.08%) VMware
11 9 (3.67%) Darktrace
11 9 (3.67%) Zscaler
12 6 (2.45%) CA Agile Central
13 5 (2.04%) MuleSoft
13 5 (2.04%) Salesforce