Entra ID Contracts in London

Microsoft Entra ID (formerly Azure Active Directory, Azure AD)
England > London

The following table provides summary statistics for contract job vacancies advertised in London with a requirement for Entra ID skills. Included is a benchmarking guide to the contractor rates offered in vacancies that have cited Entra ID over the 6 months to 28 April 2024 with a comparison to the same period in the previous 2 years.

6 months to
28 Apr 2024
Same period 2023 Same period 2022
Rank 135 155 219
Rank change year-on-year +20 +64 -12
Contract jobs citing Entra ID 321 482 530
As % of all contract jobs advertised in London 1.81% 1.78% 1.36%
As % of the Cloud Services category 4.81% 4.57% 3.28%
Number of daily rates quoted 233 335 381
10th Percentile £250 £308 £313
25th Percentile £397 £420 £463
Median daily rate (50th Percentile) £500 £550 £525
Median % change year-on-year -9.09% +4.76% +10.53%
75th Percentile £594 £650 £613
90th Percentile £725 £750 £700
England median daily rate £500 £525 £513
% change year-on-year -4.76% +2.44% +7.89%
Number of hourly rates quoted 2 9 2
10th Percentile - - £21.80
25th Percentile - £25.00 £24.83
Median hourly rate £23.80 £34.00 £30.09
Median % change year-on-year -30.00% +12.98% -32.38%
75th Percentile - £57.50 £35.15
90th Percentile - £72.35 £38.06
England median hourly rate £17.80 £32.50 £18.91
% change year-on-year -45.23% +71.84% -48.18%

All Cloud Skills
London

Entra ID is in the Cloud Services category. The following table is for comparison with the above and provides summary statistics for all contract job vacancies advertised in London with a requirement for cloud computing skills.

Contract vacancies with a requirement for cloud computing skills 6,678 10,550 16,165
As % of all contract IT jobs advertised in London 37.70% 39.01% 41.55%
Number of daily rates quoted 4,925 7,702 12,100
10th Percentile £341 £375 £400
25th Percentile £444 £475 £480
Median daily rate (50th Percentile) £550 £588 £575
Median % change year-on-year -6.38% +2.17% +9.52%
75th Percentile £675 £695 £688
90th Percentile £775 £781 £763
England median daily rate £525 £550 £550
% change year-on-year -4.55% - +10.00%
Number of hourly rates quoted 72 90 86
10th Percentile £17.78 £20.00 £16.08
25th Percentile £21.06 £24.63 £21.10
Median hourly rate £25.00 £40.00 £35.00
Median % change year-on-year -37.50% +14.29% +5.50%
75th Percentile £38.28 £70.00 £61.44
90th Percentile £62.13 £88.30 £79.13
England median hourly rate £20.77 £32.30 £21.00
% change year-on-year -35.70% +53.81% -4.55%

Entra ID
Job Vacancy Trend in London

Job postings citing Entra ID as a proportion of all IT jobs advertised in London.
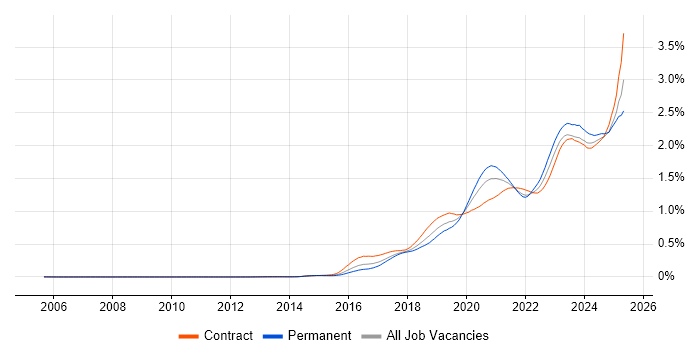
Job vacancy trend for Entra ID in London

Entra ID
Contractor Daily Rate Trend in London

3-month moving average daily rate quoted in jobs citing Entra ID in London.

Daily rate trend for Entra ID in London

Entra ID
Daily Rate Histogram in London

Daily rate distribution for jobs citing Entra ID in London over the 6 months to 28 April 2024.

Daily rate histogram for Entra ID in London

Entra ID
Contractor Hourly Rate Trend in London

3-month moving average hourly rates quoted in jobs citing Entra ID in London.

Hourly rate trend for Entra ID in London

Entra ID
Contract Job Locations in London

The table below looks at the demand and provides a guide to the median contractor rates quoted in IT jobs citing Entra ID within the London region over the 6 months to 28 April 2024. The 'Rank Change' column provides an indication of the change in demand within each location based on the same 6 month period last year.

Location Rank Change
on Same Period
Last Year
Matching
Contract
IT Job Ads
Median
Daily Rate
Past 6 Months
Median Daily Rate
% Change
on Same Period
Last Year
Live
Jobs
Central London +9 63 £513 -2.38% 13
West London +20 5 £525 +38.16% 9
South London +13 3 £430 -8.51% 7
East London -12 3 £538 +34.38% 4
Entra ID
England

Entra ID
Co-occurring Skills and Capabilities in London by Category

The follow tables expand on the table above by listing co-occurrences grouped by category. The same employment type, locality and period is covered with up to 20 co-occurrences shown in each of the following categories:

Application Platforms
1 56 (17.45%) Microsoft Exchange
2 39 (12.15%) SharePoint
3 10 (3.12%) IIS
4 9 (2.80%) Apache Spark
5 7 (2.18%) Skype for Business
6 4 (1.25%) Apache
7 3 (0.93%) Confluence
7 3 (0.93%) Tomcat
8 1 (0.31%) IBM Domino
8 1 (0.31%) IBM Notes
8 1 (0.31%) nginx
Applications
1 20 (6.23%) Microsoft Office
2 3 (0.93%) Microsoft Excel
2 3 (0.93%) Microsoft PowerPoint
2 3 (0.93%) Microsoft Project
Business Applications
1 4 (1.25%) Oracle Receivables
2 3 (0.93%) Dynamics CRM
3 1 (0.31%) Oracle ERP
3 1 (0.31%) SAP GRC
Cloud Services
1 299 (93.15%) Azure
2 141 (43.93%) Microsoft 365
3 68 (21.18%) Azure DevOps
4 35 (10.90%) IaaS
5 34 (10.59%) PaaS
6 33 (10.28%) AWS
7 29 (9.03%) Azure Cosmos DB
8 26 (8.10%) Power Platform
9 23 (7.17%) OneDrive
10 19 (5.92%) Azure Key Vault
11 18 (5.61%) SaaS
12 16 (4.98%) Azure Service Bus
12 16 (4.98%) Azure Storage
13 14 (4.36%) Azure Sentinel
14 13 (4.05%) Mimecast
15 10 (3.12%) Azure API Management
16 8 (2.49%) Dynamics 365
16 8 (2.49%) GCP
16 8 (2.49%) Power Automate
16 8 (2.49%) PowerApps
Communications & Networking
1 52 (16.20%) DNS
2 48 (14.95%) Firewall
3 13 (4.05%) DHCP
4 10 (3.12%) HTTP
5 9 (2.80%) MPLS
5 9 (2.80%) Network Security
6 8 (2.49%) LAN
7 7 (2.18%) Cisco IOS
7 7 (2.18%) Skype
7 7 (2.18%) WAN
7 7 (2.18%) Wireless
8 6 (1.87%) VPN
9 5 (1.56%) TCP/IP
10 4 (1.25%) Internet
10 4 (1.25%) SMTP
11 3 (0.93%) Cisco ASA
11 3 (0.93%) HTTPS
11 3 (0.93%) IPsec
11 3 (0.93%) Wi-Fi
12 2 (0.62%) NAS
Database & Business Intelligence
1 76 (23.68%) SQL Server
2 19 (5.92%) Power BI
3 13 (4.05%) Azure SQL Database
4 12 (3.74%) Big Data
5 9 (2.80%) Tableau
6 8 (2.49%) Apache Hive
6 8 (2.49%) Impala
7 7 (2.18%) Redis
8 6 (1.87%) Amazon RDS
9 5 (1.56%) Metadata
9 5 (1.56%) NoSQL
10 2 (0.62%) Data Lake
11 1 (0.31%) Data Warehouse
11 1 (0.31%) Hadoop
11 1 (0.31%) Oracle Reports
11 1 (0.31%) PowerCenter
Development Applications
1 14 (4.36%) Selenium
2 11 (3.43%) SpecFlow
2 11 (3.43%) Visual Studio
2 11 (3.43%) WebDriver
3 9 (2.80%) Postman
4 4 (1.25%) JIRA
5 3 (0.93%) Cucumber
5 3 (0.93%) Git
5 3 (0.93%) Robot Framework
5 3 (0.93%) SonarQube
6 1 (0.31%) GitLab
6 1 (0.31%) Jenkins
6 1 (0.31%) Katalon Studio
6 1 (0.31%) Visual Studio Code
General
1 84 (26.17%) Finance
2 57 (17.76%) Social Skills
3 29 (9.03%) Public Sector
4 15 (4.67%) Analytical Skills
4 15 (4.67%) Banking
5 11 (3.43%) Documentation Skills
6 10 (3.12%) Marketing
6 10 (3.12%) Presentation Skills
7 9 (2.80%) French Language
7 9 (2.80%) Law
8 8 (2.49%) Financial Institution
9 6 (1.87%) Local Government
9 6 (1.87%) Telecoms
10 5 (1.56%) Billing
10 5 (1.56%) Electronics
10 5 (1.56%) Legal
10 5 (1.56%) Manufacturing
11 4 (1.25%) Front Office
11 4 (1.25%) Inclusion and Diversity
11 4 (1.25%) Retail
Job Titles
1 59 (18.38%) Senior
2 54 (16.82%) Architect
3 51 (15.89%) Developer
4 37 (11.53%) Senior Developer
5 32 (9.97%) Infrastructure Engineer
6 28 (8.72%) Azure Engineer
7 26 (8.10%) Consultant
8 24 (7.48%) Backend Developer
9 23 (7.17%) Analyst
10 17 (5.30%) Azure Developer
10 17 (5.30%) Senior Backend Developer
11 15 (4.67%) Lead
11 15 (4.67%) Software Developer
12 14 (4.36%) Senior Software Developer
12 14 (4.36%) Support Engineer
13 11 (3.43%) IT Support
13 11 (3.43%) Security Engineer
13 11 (3.43%) Senior Analyst
13 11 (3.43%) Technical Architect
14 10 (3.12%) Windows Engineer
Libraries, Frameworks & Software Standards
1 65 (20.25%) .NET
2 62 (19.31%) XML
3 34 (10.59%) AngularJS
4 28 (8.72%) .NET Framework
5 26 (8.10%) .NET Core
5 26 (8.10%) SAML
6 17 (5.30%) OAuth
7 16 (4.98%) Microsoft Graph
7 16 (4.98%) REST
8 15 (4.67%) OpenID
9 12 (3.74%) ASP.NET
9 12 (3.74%) JSON
10 11 (3.43%) CSS
10 11 (3.43%) React
11 10 (3.12%) HTML
11 10 (3.12%) Web Services
12 9 (2.80%) Swagger
13 8 (2.49%) LDAP
13 8 (2.49%) PySpark
14 7 (2.18%) ASP.NET Core
Miscellaneous
1 27 (8.41%) Product Ownership
2 13 (4.05%) Data Centre
3 10 (3.12%) Cloud Native
3 10 (3.12%) Distributed Denial-of-Service
3 10 (3.12%) Management Information System
4 9 (2.80%) Onboarding
4 9 (2.80%) PKI
5 8 (2.49%) Foreign Exchange (FX)
5 8 (2.49%) Mobile App
6 7 (2.18%) iPhone
7 6 (1.87%) Self-Motivation
8 4 (1.25%) Enterprise Software
8 4 (1.25%) Hybrid Cloud
8 4 (1.25%) Virtual Team
9 3 (0.93%) Client/Server
9 3 (0.93%) Data Protection Act
9 3 (0.93%) Hedge funds
9 3 (0.93%) Public Cloud
9 3 (0.93%) Replication
9 3 (0.93%) Smartphone
Operating Systems
1 118 (36.76%) Windows
2 53 (16.51%) Windows Server
3 42 (13.08%) Windows 10
4 18 (5.61%) Linux
5 14 (4.36%) Android
6 10 (3.12%) Windows 7
7 9 (2.80%) Mac OS
7 9 (2.80%) Windows Server 2012
8 7 (2.18%) Mac OS X
9 6 (1.87%) Unix
10 3 (0.93%) Apple iOS
10 3 (0.93%) CentOS
10 3 (0.93%) Ubuntu
10 3 (0.93%) VMS
10 3 (0.93%) Windows Server 2016
11 2 (0.62%) Windows Server 2019
12 1 (0.31%) Red Hat Enterprise Linux
Processes & Methodologies
1 82 (25.55%) Agile
1 82 (25.55%) CI/CD
2 76 (23.68%) DevOps
3 60 (18.69%) B2C
4 59 (18.38%) Scrum
5 57 (17.76%) Migration
6 45 (14.02%) Infrastructure Engineering
7 43 (13.40%) Problem-Solving
8 34 (10.59%) Identity Access Management
9 28 (8.72%) Business Intelligence
10 27 (8.41%) Project Delivery
11 26 (8.10%) Data Loss Prevention
11 26 (8.10%) ITIL
12 22 (6.85%) Cybersecurity
13 19 (5.92%) Identity Management
13 19 (5.92%) Mobile Device Management
14 18 (5.61%) Software Engineering
15 17 (5.30%) Cloud Security
16 15 (4.67%) Roadmaps
16 15 (4.67%) Test Automation
Programming Languages
1 121 (37.69%) PowerShell
2 59 (18.38%) C#
3 34 (10.59%) SQL
4 25 (7.79%) Bicep
4 25 (7.79%) Python
5 20 (6.23%) JavaScript
6 8 (2.49%) Scala
7 7 (2.18%) TypeScript
8 5 (1.56%) Java
8 5 (1.56%) VB
9 3 (0.93%) Bash
9 3 (0.93%) PHP
10 1 (0.31%) C
10 1 (0.31%) C++
10 1 (0.31%) Go
10 1 (0.31%) Korn
10 1 (0.31%) Perl
10 1 (0.31%) Rust
10 1 (0.31%) tcsh
10 1 (0.31%) XPath
Qualifications
1 24 (7.48%) Degree
2 20 (6.23%) Security Cleared
3 19 (5.92%) SC Cleared
4 18 (5.61%) Azure Certification
5 11 (3.43%) Microsoft Certification
6 9 (2.80%) CISSP
7 6 (1.87%) TOGAF Certification
8 4 (1.25%) CISM
8 4 (1.25%) Computer Science Degree
9 3 (0.93%) CCIE
9 3 (0.93%) CCNP
9 3 (0.93%) CISA
9 3 (0.93%) Cisco Certification
9 3 (0.93%) ITIL Certification
10 2 (0.62%) AWS Certification
10 2 (0.62%) AWS Certified Cloud Practitioner
10 2 (0.62%) CTC Cleared
10 2 (0.62%) MCITP
11 1 (0.31%) Chartered Engineer
11 1 (0.31%) DV Cleared
Quality Assurance & Compliance
1 9 (2.80%) SLA
2 7 (2.18%) NIST
3 6 (1.87%) ISO/IEC 27001
3 6 (1.87%) QA
4 5 (1.56%) Data Quality
4 5 (1.56%) GRC
5 4 (1.25%) ISO 9001
5 4 (1.25%) PCI DSS
6 3 (0.93%) GDPR
7 2 (0.62%) COBIT
7 2 (0.62%) HIPAA
8 1 (0.31%) California Consumer Privacy Act
8 1 (0.31%) GxP
8 1 (0.31%) NCSC
8 1 (0.31%) SOC 2
System Software
1 261 (81.31%) Active Directory
2 17 (5.30%) Virtual Machines
3 9 (2.80%) Virtual Desktop
3 9 (2.80%) VMware Infrastructure
4 5 (1.56%) Docker
5 3 (0.93%) Hyper-V
6 2 (0.62%) BitLocker
6 2 (0.62%) Microsoft App-V
7 1 (0.31%) Firmware
7 1 (0.31%) NFS
7 1 (0.31%) vSphere
Systems Management
1 65 (20.25%) Microsoft Intune
2 43 (13.40%) SCCM
3 25 (7.79%) Single Sign-On
4 19 (5.92%) Active Directory Federation Services
5 16 (4.98%) Terraform
6 14 (4.36%) Jamf Pro
7 8 (2.49%) Kubernetes
7 8 (2.49%) Puppet
8 7 (2.18%) Ansible
9 6 (1.87%) FortiGate
10 4 (1.25%) PingFederate
11 3 (0.93%) Netcool
12 2 (0.62%) Consul
12 2 (0.62%) NetBackup
12 2 (0.62%) Packer
12 2 (0.62%) SCOM
12 2 (0.62%) SCVMM
12 2 (0.62%) VxRail
13 1 (0.31%) PowerCLI
13 1 (0.31%) RSA Archer
Vendors
1 223 (69.47%) Microsoft
2 24 (7.48%) VMware
3 19 (5.92%) Okta
4 18 (5.61%) Citrix
5 17 (5.30%) Apple
5 17 (5.30%) Cisco
6 13 (4.05%) Talend
7 11 (3.43%) CA
8 10 (3.12%) Oracle
8 10 (3.12%) ServiceNow
9 9 (2.80%) Mitel
10 7 (2.18%) Ping Identity
10 7 (2.18%) Progress
10 7 (2.18%) Qualys
11 6 (1.87%) MuleSoft
11 6 (1.87%) SAP
12 5 (1.56%) CyberArk
12 5 (1.56%) Google
12 5 (1.56%) Informatica
12 5 (1.56%) Symantec