Spring Contracts with Hybrid/Remote/WFH Options

Pivotal Spring Framework
UK > Work from Home

The table below provides summary statistics for remote or hybrid contract work requiring Spring skills. It includes a benchmarking guide to the contractor rates offered in vacancies that cited Spring over the 6 months leading up to 2 May 2025, comparing them to the same period in the previous two years.

6 months to
2 May 2025
Same period 2024 Same period 2023
Rank 139 189 114
Rank change year-on-year +50 -75 -16
Contract jobs citing Spring 180 164 552
As % of all contract jobs with a WFH option 1.82% 1.07% 2.15%
As % of the Libraries, Frameworks & Software Standards category 6.99% 4.48% 8.50%
Number of daily rates quoted 119 124 416
10th Percentile £399 £400 £450
25th Percentile £433 £450 £484
Median daily rate (50th Percentile) £525 £509 £575
Median % change year-on-year +3.09% -11.43% +4.55%
75th Percentile £575 £625 £700
90th Percentile £738 £700 £750
UK median daily rate £508 £525 £600
% change year-on-year -3.33% -12.50% +3.45%
Number of hourly rates quoted 2 1 24
10th Percentile - - £54.13
25th Percentile £87.50 - £61.25
Median hourly rate £90.00 £35.00 £72.50
Median % change year-on-year +157.14% -51.72% +20.83%
75th Percentile £92.50 - £75.00
90th Percentile - - -
UK median hourly rate £73.75 £45.88 £72.50
% change year-on-year +60.75% -36.72% +11.54%

All Software Libraries and Frameworks
Work from Home

Spring falls under the Software Libraries and Frameworks category. For comparison with the information above, the following table provides summary statistics for all contract job vacancies with remote or hybrid options requiring technical specification, industry standards, software libraries and framework skills.

Contract vacancies with a requirement for technical specification, industry standards, software libraries and framework skills 2,574 3,659 6,491
As % of all contract jobs with a WFH option 25.99% 23.89% 25.23%
Number of daily rates quoted 1,876 2,553 4,822
10th Percentile £367 £331 £394
25th Percentile £425 £425 £450
Median daily rate (50th Percentile) £525 £525 £540
Median % change year-on-year - -2.78% -0.46%
75th Percentile £650 £650 £660
90th Percentile £825 £775 £753
UK median daily rate £525 £530 £550
% change year-on-year -0.94% -3.64% -
Number of hourly rates quoted 31 93 81
10th Percentile £52.50 £28.00 £22.50
25th Percentile £61.25 - £43.50
Median hourly rate £65.00 £43.00 £62.50
Median % change year-on-year +51.16% -31.20% +27.55%
75th Percentile £70.25 £62.00 £75.00
90th Percentile £93.75 £72.50 £80.25
UK median hourly rate £65.00 £46.18 £65.00
% change year-on-year +40.75% -28.95% +32.65%

Spring
Trend for Jobs with a WFH Option

Job vacancies with remote working options citing Spring as a proportion of all IT jobs advertised.
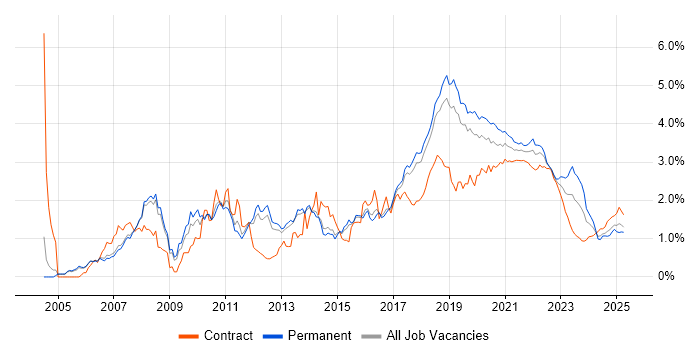
Spring trend for jobs with Hybrid/Remote/WFH options

Spring
Daily Rate Trend for Jobs with a WFH Option

3-month moving average daily rate quoted in job vacancies with remote working options citing Spring.

Spring daily rate for jobs with a WFH option

Spring
Daily Rate Histogram for Jobs with a WFH Option

Daily rate distribution for jobs with remote working options citing Spring over the 6 months to 2 May 2025.

Spring daily rate histogram for jobs with a WFH option

Spring
Hourly Rate Trend for Jobs with a WFH Option

3-month moving average hourly rate quoted in job vacancies with remote working options citing Spring.

Spring hourly rate for jobs with a WFH option

Spring
Co-occurring Skills and Capabilities with WFH Options by Category

The follow tables expand on the table above by listing co-occurrences grouped by category. The same employment type, locality and period is covered with up to 20 co-occurrences shown in each of the following categories:

Application Platforms
1 8 (4.44%) Confluence
2 3 (1.67%) Apache
2 3 (1.67%) Camunda
3 2 (1.11%) GeoServer
4 1 (0.56%) Apache Spark
4 1 (0.56%) JBoss
4 1 (0.56%) Jupyter
4 1 (0.56%) Tomcat
4 1 (0.56%) WebSphere
Business Applications
1 3 (1.67%) Oracle EBS
2 1 (0.56%) Oracle EBS R12
2 1 (0.56%) SAP CX
2 1 (0.56%) SAP Hybris
Cloud Services
1 64 (35.56%) AWS
2 16 (8.89%) Azure
3 10 (5.56%) GCP
3 10 (5.56%) Serverless
4 8 (4.44%) Amazon S3
4 8 (4.44%) Amazon SQS
5 7 (3.89%) AWS Lambda
6 6 (3.33%) Slack
7 5 (2.78%) Kong
7 5 (2.78%) SaaS
8 4 (2.22%) Amazon ECS
8 4 (2.22%) IaaS
8 4 (2.22%) OpenShift
8 4 (2.22%) PaaS
9 3 (1.67%) AWS CloudFormation
9 3 (1.67%) AWS KMS
9 3 (1.67%) Azure DevOps
9 3 (1.67%) Cloud Computing
9 3 (1.67%) Google Compute Engine
9 3 (1.67%) Route 53
Communications & Networking
1 6 (3.33%) HTTP
2 4 (2.22%) SSL
3 3 (1.67%) IPsec
3 3 (1.67%) Kerberos
4 1 (0.56%) Firewall
4 1 (0.56%) FTP
4 1 (0.56%) SMS
Database & Business Intelligence
1 52 (28.89%) MongoDB
2 49 (27.22%) Relational Database
3 35 (19.44%) PostgreSQL
4 34 (18.89%) DB2
5 21 (11.67%) MySQL
6 18 (10.00%) NoSQL
7 10 (5.56%) Apache Cassandra
7 10 (5.56%) Redis
8 5 (2.78%) Amazon RDS
8 5 (2.78%) RDBMS
8 5 (2.78%) SQL Server
9 4 (2.22%) GIS
9 4 (2.22%) Metadata
10 3 (1.67%) Amazon Aurora
10 3 (1.67%) Hazelcast
11 2 (1.11%) Oracle Database
11 2 (1.11%) SQL Server Integration Services
12 1 (0.56%) DynamoDB
12 1 (0.56%) Elasticsearch
12 1 (0.56%) MariaDB
Development Applications
1 62 (34.44%) JUnit
2 34 (18.89%) Jenkins
3 31 (17.22%) Maven
4 28 (15.56%) Git
5 20 (11.11%) Gradle
6 16 (8.89%) Mockito
7 15 (8.33%) JIRA
8 13 (7.22%) GitLab
9 9 (5.00%) Cucumber
9 9 (5.00%) Liquibase
10 6 (3.33%) IntelliJ
10 6 (3.33%) Jasmine
11 5 (2.78%) Selenium
11 5 (2.78%) SonarQube
11 5 (2.78%) Subversion
12 4 (2.22%) CA Release Automation
13 3 (1.67%) HP UFT
13 3 (1.67%) NetBeans
13 3 (1.67%) Postman
13 3 (1.67%) Sonatype Nexus
General
1 54 (30.00%) Social Skills
2 52 (28.89%) Finance
3 41 (22.78%) Banking
4 35 (19.44%) Analytical Skills
5 28 (15.56%) Investment Banking
6 16 (8.89%) Public Sector
7 14 (7.78%) Front Office
8 8 (4.44%) Retail
9 3 (1.67%) Financial Institution
10 2 (1.11%) Corporate Banking
10 2 (1.11%) Retail Banking
10 2 (1.11%) Telecoms
10 2 (1.11%) Wholesale Banking
11 1 (0.56%) Dutch Language
11 1 (0.56%) Inclusion and Diversity
11 1 (0.56%) Military
11 1 (0.56%) Pharmaceutical
11 1 (0.56%) Presentation Skills
Job Titles
1 120 (66.67%) Developer
2 106 (58.89%) Java Developer
3 32 (17.78%) Senior
4 31 (17.22%) Lead
5 26 (14.44%) SQL Developer
6 23 (12.78%) Senior Developer
6 23 (12.78%) Senior Java Developer
7 22 (12.22%) Full-Stack Developer
8 19 (10.56%) Linux Developer
9 18 (10.00%) Investment Banking Java Developer
10 17 (9.44%) Full-Stack Java Developer
10 17 (9.44%) Java Engineer
11 16 (8.89%) Lead Developer
12 13 (7.22%) Lead Java Developer
13 12 (6.67%) Software Engineer
14 11 (6.11%) Architect
14 11 (6.11%) Senior Investment Banking Java Developer
14 11 (6.11%) Senior SQL Developer
15 8 (4.44%) SC Cleared Java Developer
16 7 (3.89%) Senior Java Engineer
Libraries, Frameworks & Software Standards
1 106 (58.89%) Spring Boot
2 65 (36.11%) Kafka
3 29 (16.11%) React
3 29 (16.11%) RESTful
4 26 (14.44%) JMS
5 23 (12.78%) Swagger
6 22 (12.22%) AngularJS
7 21 (11.67%) Hibernate
8 20 (11.11%) OpenAPI
9 16 (8.89%) HTML
9 16 (8.89%) REST
10 14 (7.78%) CSS
10 14 (7.78%) OAuth
11 13 (7.22%) Node.js
12 12 (6.67%) Web Services
13 11 (6.11%) J2EE
14 9 (5.00%) Spring Batch
14 9 (5.00%) Spring Security
15 8 (4.44%) HTML5
15 8 (4.44%) JWT
Miscellaneous
1 35 (19.44%) Data Structures
2 28 (15.56%) Equities
3 9 (5.00%) Distributed Denial-of-Service
3 9 (5.00%) Distributed Systems
4 8 (4.44%) Linux Command Line
5 6 (3.33%) Enterprise Software
5 6 (3.33%) Equity Derivative
6 5 (2.78%) Derivative
7 4 (2.22%) Public Cloud
8 3 (1.67%) Cloud Native
8 3 (1.67%) Data Protection Act
8 3 (1.67%) Mainframe
9 2 (1.11%) Legacy Systems
9 2 (1.11%) PKI
9 2 (1.11%) Virtual Team
10 1 (0.56%) Algorithms
10 1 (0.56%) Cyber Threat
10 1 (0.56%) Data Centre
10 1 (0.56%) Onboarding
10 1 (0.56%) Product Ownership
Operating Systems
1 55 (30.56%) Linux
2 7 (3.89%) Red Hat Enterprise Linux
2 7 (3.89%) Unix
3 1 (0.56%) Windows
Processes & Methodologies
1 90 (50.00%) Agile
2 76 (42.22%) Microservices
3 62 (34.44%) CI/CD
4 55 (30.56%) Problem-Solving
5 41 (22.78%) Software Engineering
6 37 (20.56%) SDLC
7 36 (20.00%) Containerisation
8 35 (19.44%) DevOps
8 35 (19.44%) TDD
9 34 (18.89%) Multithreading
10 30 (16.67%) Open Source
11 29 (16.11%) Full-Stack Development
12 27 (15.00%) Performance Tuning
13 26 (14.44%) Database Tuning
14 25 (13.89%) Continuous Integration
15 23 (12.78%) Mentoring
16 22 (12.22%) Migration
17 17 (9.44%) Technical Leadership
18 16 (8.89%) Scrum
18 16 (8.89%) Test Automation
Programming Languages
1 178 (98.89%) Java
2 87 (48.33%) SQL
3 50 (27.78%) Python
4 30 (16.67%) Shell Script
5 28 (15.56%) JavaScript
6 25 (13.89%) TypeScript
7 9 (5.00%) Bash
8 6 (3.33%) Perl
9 4 (2.22%) Groovy
10 3 (1.67%) Kotlin
10 3 (1.67%) PL/SQL
10 3 (1.67%) PowerShell
10 3 (1.67%) Scala
11 1 (0.56%) C
11 1 (0.56%) C#
11 1 (0.56%) COBOL
11 1 (0.56%) JCL
Qualifications
1 31 (17.22%) SC Cleared
1 31 (17.22%) Security Cleared
2 14 (7.78%) Degree
3 11 (6.11%) Computer Science Degree
4 2 (1.11%) AWS Certification
4 2 (1.11%) BPSS Clearance
4 2 (1.11%) TOGAF Certification
5 1 (0.56%) AWS Certified Solutions Architect
5 1 (0.56%) Azure Certification
5 1 (0.56%) CTC Cleared
5 1 (0.56%) Microsoft Certification
Quality Assurance & Compliance
1 7 (3.89%) Disclosure Scotland
2 6 (3.33%) QA
3 5 (2.78%) GDPR
4 2 (1.11%) Accessibility
4 2 (1.11%) HIPAA
4 2 (1.11%) Sarbanes-Oxley
4 2 (1.11%) SLA
5 1 (0.56%) PCI DSS
System Software
1 66 (36.67%) Docker
2 3 (1.67%) RACF
3 2 (1.11%) Apache ZooKeeper
4 1 (0.56%) Active Directory
Systems Management
1 43 (23.89%) Kubernetes
2 23 (12.78%) Terraform
3 8 (4.44%) Ansible
3 8 (4.44%) Grafana
3 8 (4.44%) Prometheus
4 7 (3.89%) Progress Chef
4 7 (3.89%) Puppet
4 7 (3.89%) Single Sign-On
5 6 (3.33%) Istio
6 3 (1.67%) Control-M
6 3 (1.67%) Packer
6 3 (1.67%) Rundeck
7 2 (1.11%) Tivoli Identity Manager
8 1 (0.56%) Argo
8 1 (0.56%) Kibana
8 1 (0.56%) Rancher
Vendors
1 36 (20.00%) Sybase
2 16 (8.89%) Oracle
3 7 (3.89%) Google
4 5 (2.78%) CA Agile Central
4 5 (2.78%) Microsoft
5 4 (2.22%) Red Hat
5 4 (2.22%) Splunk
6 3 (1.67%) Dynatrace
6 3 (1.67%) IBM
7 2 (1.11%) Atlassian
7 2 (1.11%) Ping Identity
8 1 (0.56%) AppDynamics
8 1 (0.56%) Databricks
8 1 (0.56%) MuleSoft
8 1 (0.56%) Okta
8 1 (0.56%) SAP
8 1 (0.56%) ServiceNow
8 1 (0.56%) Talend
8 1 (0.56%) WSO2