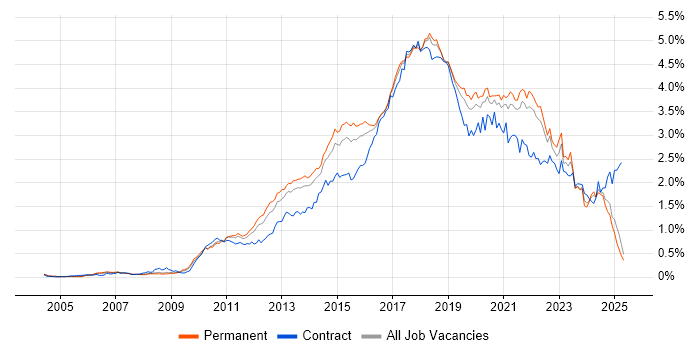
Continuous Integration Jobs in the South East

Continuous Integration
England > South East

The table below provides summary statistics for permanent job vacancies advertised in the South East requiring Continuous Integration skills. It includes a benchmarking guide to the annual salaries offered in vacancies that cited Continuous Integration over the 6 months leading up to 26 July 2024, comparing them to the same period in the previous two years.

6 months to
26 Jul 2024
Same period 2023 Same period 2022
Rank 164 101 86
Rank change year-on-year -63 -15 -2
Permanent jobs citing Continuous Integration 226 360 860
As % of all permanent jobs advertised in the South East 1.50% 3.11% 3.90%
As % of the Processes & Methodologies category 1.84% 3.27% 4.09%
Number of salaries quoted 181 133 355
10th Percentile £43,750 £46,750 £43,000
25th Percentile £53,750 £47,500 £48,750
Median annual salary (50th Percentile) £61,500 £62,500 £57,500
Median % change year-on-year -1.60% +8.70% +4.55%
75th Percentile £82,500 £68,750 £73,000
90th Percentile £85,000 £77,500 £86,500
England median annual salary £65,000 £67,750 £67,500
% change year-on-year -4.06% +0.37% +8.00%

All Process and Methodology Skills
South East

Continuous Integration falls under the Processes and Methodologies category. For comparison with the information above, the following table provides summary statistics for all permanent job vacancies requiring process or methodology skills in the South East.

Permanent vacancies with a requirement for process or methodology skills 12,301 10,994 21,004
As % of all permanent jobs advertised in the South East 81.50% 94.87% 95.19%
Number of salaries quoted 8,138 7,007 11,964
10th Percentile £29,000 £30,500 £31,250
25th Percentile £38,620 £41,250 £41,250
Median annual salary (50th Percentile) £50,000 £55,000 £55,000
Median % change year-on-year -9.09% - +8.01%
75th Percentile £65,000 £71,250 £71,250
90th Percentile £80,000 £85,000 £82,500
England median annual salary £55,000 £62,000 £60,000
% change year-on-year -11.29% +3.33% +4.35%

Continuous Integration
Job Vacancy Trend in the South East

Job postings citing Continuous Integration as a proportion of all IT jobs advertised in the South East.

Job vacancy trend for Continuous Integration in the South East

Continuous Integration
Salary Trend in the South East

3-month moving average salary quoted in jobs citing Continuous Integration in the South East.

Salary trend for Continuous Integration in the South East

Continuous Integration
Salary Histogram in the South East

Salary distribution for jobs citing Continuous Integration in the South East over the 6 months to 26 July 2024.

Salary histogram for Continuous Integration in the South East

Continuous Integration
Job Locations in the South East

The table below looks at the demand and provides a guide to the median salaries quoted in IT jobs citing Continuous Integration within the South East region over the 6 months to 26 July 2024. The 'Rank Change' column provides an indication of the change in demand within each location based on the same 6 month period last year.

Location Rank Change
on Same Period
Last Year
Matching
Permanent
IT Job Ads
Median Salary
Past 6 Months
Median Salary
% Change
on Same Period
Last Year
Live
Jobs
Thames Valley -23 74 £61,500 -8.89% 6
Hampshire -37 55 £80,000 +42.86% 13
Surrey -31 52 £80,000 +23.08% 2
Berkshire -5 32 £61,500 -18.00% 1
Oxfordshire -7 23 £61,500 +23.00% 3
Buckinghamshire -36 19 £47,500 -28.30% 2
West Sussex +14 17 £57,500 -14.81% 4
Kent -24 12 £65,000 +33.61% 2
East Sussex -7 8 £57,500 +0.32% 4
Continuous Integration
England

Continuous Integration
Co-occurring Skills and Capabilities in the South East by Category

The follow tables expand on the table above by listing co-occurrences grouped by category. The same employment type, locality and period is covered with up to 20 co-occurrences shown in each of the following categories:

Application Platforms
1 14 (6.19%) CMS
1 14 (6.19%) Headless CMS
1 14 (6.19%) IIS
1 14 (6.19%) Kentico
1 14 (6.19%) Sitecore CMS
1 14 (6.19%) Umbraco
2 8 (3.54%) Apache
3 4 (1.77%) Confluence
4 3 (1.33%) nginx
4 3 (1.33%) SharePoint
5 1 (0.44%) Kinematics
5 1 (0.44%) WordPress
Applications
1 32 (14.16%) Simulink
2 3 (1.33%) MS Visio
3 2 (0.88%) OrCAD
4 1 (0.44%) Microsoft Office
Business Applications
1 11 (4.87%) Dynamics CRM
Cloud Services
1 77 (34.07%) Azure
2 45 (19.91%) AWS
2 45 (19.91%) Azure DevOps
3 17 (7.52%) Serverless
4 14 (6.19%) Kontent
5 12 (5.31%) Dynamics 365
5 12 (5.31%) PaaS
6 11 (4.87%) AWS Lambda
7 8 (3.54%) Azure Functions
7 8 (3.54%) Entra ID
8 7 (3.10%) Azure Cosmos DB
8 7 (3.10%) IaaS
8 7 (3.10%) Microsoft 365
9 5 (2.21%) Azure Synapse Analytics
9 5 (2.21%) GitHub
9 5 (2.21%) Power Automate
10 4 (1.77%) Amazon CloudWatch
10 4 (1.77%) Amazon EC2
10 4 (1.77%) AWS CloudFormation
10 4 (1.77%) GCP
Communications & Networking
1 8 (3.54%) HTTP
2 5 (2.21%) Ethernet
3 3 (1.33%) Internet
3 3 (1.33%) MQTT
3 3 (1.33%) RS-485
3 3 (1.33%) Software-Defined Radio
3 3 (1.33%) Wireless
4 2 (0.88%) 4G
4 2 (0.88%) 5G
4 2 (0.88%) Bluetooth
4 2 (0.88%) LoRaWAN
4 2 (0.88%) Modbus
4 2 (0.88%) Network Security
4 2 (0.88%) RS-232
4 2 (0.88%) TCP/IP
5 1 (0.44%) DHCP
5 1 (0.44%) DNS
5 1 (0.44%) HTTPS
5 1 (0.44%) VLAN
5 1 (0.44%) VPN
Database & Business Intelligence
1 39 (17.26%) PostgreSQL
2 28 (12.39%) SQL Server
3 23 (10.18%) Relational Database
4 19 (8.41%) NoSQL
5 15 (6.64%) MySQL
6 8 (3.54%) MongoDB
7 7 (3.10%) DynamoDB
8 5 (2.21%) Azure SQL Database
8 5 (2.21%) Big Data
9 4 (1.77%) Amazon RDS
10 3 (1.33%) Hadoop
11 1 (0.44%) Apache Cassandra
11 1 (0.44%) Couchbase
11 1 (0.44%) Elasticsearch
11 1 (0.44%) Power BI
11 1 (0.44%) Qlik Sense
11 1 (0.44%) Redis
11 1 (0.44%) Tableau
Development Applications
1 55 (24.34%) Git
2 18 (7.96%) Selenium
3 15 (6.64%) JIRA
4 14 (6.19%) Jenkins
4 14 (6.19%) Visual Studio
5 13 (5.75%) WebDriver
6 12 (5.31%) GitLab
7 10 (4.42%) Cucumber
8 9 (3.98%) JUnit
9 8 (3.54%) MSBuild
9 8 (3.54%) NUnit
9 8 (3.54%) Team Foundation Server
10 6 (2.65%) Maven
11 5 (2.21%) REST Assured
11 5 (2.21%) TestNG
12 4 (1.77%) Bitbucket
12 4 (1.77%) TeamCity
13 3 (1.33%) Eclipse
13 3 (1.33%) SonarQube
13 3 (1.33%) TestRail
General
1 108 (47.79%) Social Skills
2 57 (25.22%) Finance
3 20 (8.85%) Analytical Skills
4 15 (6.64%) Electronics
4 15 (6.64%) Marketing
5 14 (6.19%) Public Sector
6 12 (5.31%) Telecoms
7 11 (4.87%) Manufacturing
8 10 (4.42%) Law
9 8 (3.54%) Inclusion and Diversity
10 5 (2.21%) Aviation
10 5 (2.21%) Military
10 5 (2.21%) Swedish Language
11 4 (1.77%) Aerospace
11 4 (1.77%) Organisational Skills
12 1 (0.44%) Automotive
12 1 (0.44%) Games
12 1 (0.44%) Pharmaceutical
12 1 (0.44%) Retail
Job Titles
1 137 (60.62%) Developer
2 81 (35.84%) Senior
3 62 (27.43%) Senior Developer
4 37 (16.37%) Software Developer
5 33 (14.60%) .NET Developer
6 32 (14.16%) Embedded Developer
6 32 (14.16%) Embedded Software Developer
7 30 (13.27%) C# .NET Developer
7 30 (13.27%) C# Developer
8 29 (12.83%) Senior .NET Developer
9 28 (12.39%) Senior C# .NET Developer
9 28 (12.39%) Senior C# Developer
10 25 (11.06%) Software Engineer
11 19 (8.41%) DevOps Engineer
11 19 (8.41%) Lead
12 18 (7.96%) .NET Applications Developer
12 18 (7.96%) Applications Developer
13 16 (7.08%) ASP.NET Developer
13 16 (7.08%) C# Application Developer
13 16 (7.08%) Senior ASP.NET Developer
Libraries, Frameworks & Software Standards
1 62 (27.43%) .NET
2 40 (17.70%) REST
2 40 (17.70%) Web Services
3 37 (16.37%) gRPC
4 33 (14.60%) GraphQL
4 33 (14.60%) Kafka
5 31 (13.72%) RESTful
6 30 (13.27%) .NET Framework
6 30 (13.27%) RabbitMQ
6 30 (13.27%) React
7 24 (10.62%) .NET Core
8 20 (8.85%) AngularJS
8 20 (8.85%) ASP.NET
8 20 (8.85%) ASP.NET MVC
9 18 (7.96%) CSS
10 14 (6.19%) Next.js
11 13 (5.75%) HTML
12 9 (3.98%) JSON
13 8 (3.54%) Spring
13 8 (3.54%) XML
Miscellaneous
1 20 (8.85%) Self-Motivation
2 11 (4.87%) Algorithms
3 7 (3.10%) Cloud Native
3 7 (3.10%) Distributed Systems
3 7 (3.10%) Private Cloud
4 6 (2.65%) Robotics
5 5 (2.21%) Embedded Systems
5 5 (2.21%) Enterprise Software
5 5 (2.21%) FPGA
5 5 (2.21%) IoT
6 4 (1.77%) Replication
7 3 (1.33%) ARM Cortex
7 3 (1.33%) Device Driver
7 3 (1.33%) Management Information System
7 3 (1.33%) VHDL
8 2 (0.88%) iPhone
8 2 (0.88%) NB-IoT
8 2 (0.88%) Onboarding
9 1 (0.44%) Distributed Computing
9 1 (0.44%) Legacy Systems
Operating Systems
1 52 (23.01%) Linux
2 44 (19.47%) Embedded Linux
3 6 (2.65%) Windows
4 2 (0.88%) Ubuntu
4 2 (0.88%) Unix
5 1 (0.44%) Windows Server
5 1 (0.44%) Windows Server 2012
5 1 (0.44%) Windows Server 2016
Processes & Methodologies
1 110 (48.67%) DevOps
2 89 (39.38%) Agile
3 86 (38.05%) CI/CD
4 84 (37.17%) Problem-Solving
5 76 (33.63%) Software Engineering
6 63 (27.88%) Continuous Deployment
7 62 (27.43%) Microservices
8 57 (25.22%) TDD
9 54 (23.89%) Code Quality
10 53 (23.45%) Computer Science
10 53 (23.45%) Test Automation
11 39 (17.26%) System Testing
12 37 (16.37%) Artificial Intelligence
12 37 (16.37%) Signal Processing
13 35 (15.49%) Collaborative Working
14 34 (15.04%) Machine Learning
15 33 (14.60%) Containerisation
15 33 (14.60%) Embedded Software Development
16 30 (13.27%) CRM
16 30 (13.27%) Regression Testing
Programming Languages
1 73 (32.30%) Java
2 72 (31.86%) Python
3 60 (26.55%) C#
4 54 (23.89%) C
5 50 (22.12%) JavaScript
6 49 (21.68%) C++
7 33 (14.60%) Go
8 32 (14.16%) SQL
9 23 (10.18%) TypeScript
10 10 (4.42%) Bash
11 9 (3.98%) PHP
12 8 (3.54%) Embedded C
12 8 (3.54%) VB.NET
13 5 (2.21%) MATLAB
13 5 (2.21%) PowerShell
14 3 (1.33%) Embedded C++
15 2 (0.88%) Assembly Language
15 2 (0.88%) Bicep
15 2 (0.88%) Fortran
16 1 (0.44%) Ruby
Qualifications
1 88 (38.94%) Degree
2 58 (25.66%) Security Cleared
3 46 (20.35%) Computer Science Degree
4 37 (16.37%) DV Cleared
5 14 (6.19%) SC Cleared
6 7 (3.10%) Master's Degree
7 4 (1.77%) AWS Certification
7 4 (1.77%) AWS Certified Developer
7 4 (1.77%) AWS Certified Solutions Architect
8 3 (1.33%) ISTQB
8 3 (1.33%) ISTQB Foundation Certification
Quality Assurance & Compliance
1 32 (14.16%) QA
2 7 (3.10%) GDPR
2 7 (3.10%) HIPAA
3 2 (0.88%) ISO/IEC 27001
4 1 (0.44%) Accessibility
System Software
1 66 (29.20%) Docker
2 7 (3.10%) Firmware
3 5 (2.21%) Active Directory
3 5 (2.21%) Virtual Machines
4 2 (0.88%) Embedded Firmware
Systems Management
1 31 (13.72%) Kubernetes
2 9 (3.98%) Terraform
3 8 (3.54%) Ansible
4 5 (2.21%) SELinux
5 3 (1.33%) Podman
5 3 (1.33%) Puppet
6 1 (0.44%) Progress Chef
6 1 (0.44%) Salt
Vendors
1 37 (16.37%) Microsoft
2 32 (14.16%) Xilinx
3 14 (6.19%) Optimizely
3 14 (6.19%) Sitecore
4 11 (4.87%) SAP
5 8 (3.54%) Google
6 4 (1.77%) New Relic
7 3 (1.33%) Oracle
7 3 (1.33%) Renesas
8 2 (0.88%) Atmel
8 2 (0.88%) Freescale
9 1 (0.44%) Atlassian
9 1 (0.44%) Splunk