Jenkins Jobs in the South East

Jenkins (JenkinsCI)
England > South East

The table below provides summary statistics for permanent job vacancies advertised in the South East requiring Jenkins skills. It includes a benchmarking guide to the annual salaries offered in vacancies that cited Jenkins over the 6 months leading up to 26 July 2024, comparing them to the same period in the previous two years.

6 months to
26 Jul 2024
Same period 2023 Same period 2022
Rank 192 122 77
Rank change year-on-year -70 -45 -23
Permanent jobs citing Jenkins 175 316 916
As % of all permanent jobs advertised in the South East 1.16% 2.73% 4.15%
As % of the Development Applications category 13.73% 19.37% 20.60%
Number of salaries quoted 105 128 362
10th Percentile £45,000 £47,500 £44,750
25th Percentile £47,500 £54,688 £52,500
Median annual salary (50th Percentile) £60,000 £67,500 £63,750
Median % change year-on-year -11.11% +5.88% +6.25%
75th Percentile £76,250 £80,000 £80,938
90th Percentile £83,750 £86,250 £86,250
England median annual salary £75,000 £75,000 £72,500
% change year-on-year - +3.45% +11.54%

All Development Application Skills
South East

Jenkins falls under the Development Applications category. For comparison with the information above, the following table provides summary statistics for all permanent job vacancies requiring development application skills in the South East.

Permanent vacancies with a requirement for development application skills 1,275 1,631 4,446
As % of all permanent jobs advertised in the South East 8.45% 14.07% 20.15%
Number of salaries quoted 921 1,120 2,398
10th Percentile £38,500 £39,149 £36,250
25th Percentile £46,250 £48,563 £45,000
Median annual salary (50th Percentile) £57,500 £60,000 £57,500
Median % change year-on-year -4.17% +4.35% +9.52%
75th Percentile £72,500 £75,000 £72,500
90th Percentile £83,750 £91,375 £84,125
England median annual salary £60,000 £65,000 £62,500
% change year-on-year -7.69% +4.00% +8.70%

Jenkins
Job Vacancy Trend in the South East

Job postings citing Jenkins as a proportion of all IT jobs advertised in the South East.
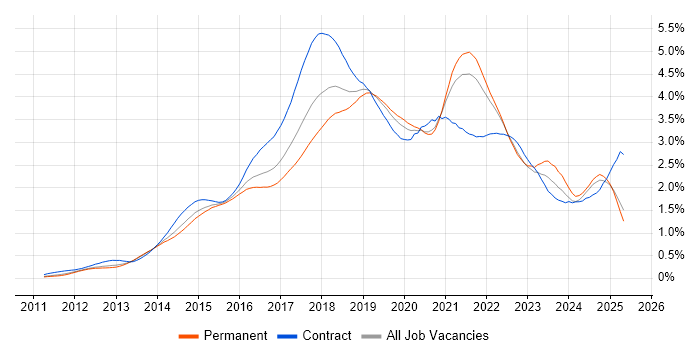
Job vacancy trend for Jenkins in the South East

Jenkins
Salary Trend in the South East

3-month moving average salary quoted in jobs citing Jenkins in the South East.

Salary trend for Jenkins in the South East

Jenkins
Salary Histogram in the South East

Salary distribution for jobs citing Jenkins in the South East over the 6 months to 26 July 2024.

Salary histogram for Jenkins in the South East

Jenkins
Job Locations in the South East

The table below looks at the demand and provides a guide to the median salaries quoted in IT jobs citing Jenkins within the South East region over the 6 months to 26 July 2024. The 'Rank Change' column provides an indication of the change in demand within each location based on the same 6 month period last year.

Location Rank Change
on Same Period
Last Year
Matching
Permanent
IT Job Ads
Median Salary
Past 6 Months
Median Salary
% Change
on Same Period
Last Year
Live
Jobs
Thames Valley -36 68 £72,500 -2.68% 3
Surrey -12 55 £50,000 -23.08% 1
Berkshire -29 50 £82,500 +3.13%
Hampshire -64 22 £60,000 -7.69% 1
Kent -6 16 £55,000 -
Oxfordshire -17 13 £72,500 +7.41% 2
West Sussex +19 5 £70,000 +7.69% 4
Buckinghamshire -11 5 £60,000 -7.69% 1
East Sussex -9 3 £80,000 +36.17% 6
Middlesex -25 2 £57,500 +15.00%
Jenkins
England

Jenkins
Co-occurring Skills and Capabilities in the South East by Category

The follow tables expand on the table above by listing co-occurrences grouped by category. The same employment type, locality and period is covered with up to 20 co-occurrences shown in each of the following categories:

Application Platforms
1 16 (9.14%) OpenStack
2 8 (4.57%) JBoss
3 7 (4.00%) Red Hat Fuse
4 2 (1.14%) Apache
4 2 (1.14%) Oracle SOA Suite
5 1 (0.57%) Apache Spark
5 1 (0.57%) Confluence
5 1 (0.57%) IIS
5 1 (0.57%) Tomcat
5 1 (0.57%) WildFly
Applications
1 2 (1.14%) OrCAD
2 1 (0.57%) Microsoft Office
Business Applications
1 3 (1.71%) Oracle Applications
Cloud Services
1 57 (32.57%) AWS
2 53 (30.29%) Azure
3 27 (15.43%) GitHub
4 24 (13.71%) Serverless
5 23 (13.14%) Azure DevOps
6 22 (12.57%) Amazon ECS
6 22 (12.57%) Amazon EKS
6 22 (12.57%) Cloud Computing
7 19 (10.86%) SaaS
8 8 (4.57%) Amazon EC2
9 7 (4.00%) GCP
10 5 (2.86%) Microsoft 365
11 4 (2.29%) AWS CloudFormation
12 3 (1.71%) Amazon SageMaker
12 3 (1.71%) AWS Lambda
12 3 (1.71%) Datadog
13 2 (1.14%) Amazon S3
13 2 (1.14%) AWS Step Functions
14 1 (0.57%) Amazon SQS
14 1 (0.57%) PaaS
Communications & Networking
1 23 (13.14%) Firewall
2 11 (6.29%) 5G
3 10 (5.71%) VPN
4 9 (5.14%) DHCP
4 9 (5.14%) DNS
5 7 (4.00%) LAN
5 7 (4.00%) WAN
6 5 (2.86%) Intrusion Detection
6 5 (2.86%) OpenLDAP
7 4 (2.29%) TCP/IP
8 3 (1.71%) Ethernet
8 3 (1.71%) Internet
9 2 (1.14%) 4G
9 2 (1.14%) Bluetooth
9 2 (1.14%) LoRaWAN
9 2 (1.14%) Modbus
9 2 (1.14%) MQTT
9 2 (1.14%) RS-232
9 2 (1.14%) RS-485
9 2 (1.14%) Wireless
Database & Business Intelligence
1 34 (19.43%) PostgreSQL
2 25 (14.29%) NoSQL
3 16 (9.14%) MongoDB
3 16 (9.14%) Redis
3 16 (9.14%) Relational Database
4 13 (7.43%) MySQL
5 10 (5.71%) SQL Server
6 7 (4.00%) RDBMS
7 6 (3.43%) SQLite
8 5 (2.86%) InfluxDB
8 5 (2.86%) MariaDB
9 3 (1.71%) Apache Cassandra
9 3 (1.71%) Couchbase
10 1 (0.57%) Amazon RDS
10 1 (0.57%) Elasticsearch
10 1 (0.57%) SQL Server Analysis Services
10 1 (0.57%) SQL Server Integration Services
Development Applications
1 74 (42.29%) Git
2 49 (28.00%) JIRA
3 23 (13.14%) GitLab
4 18 (10.29%) JUnit
5 16 (9.14%) Octopus Deploy
6 15 (8.57%) JMeter
6 15 (8.57%) Robot Framework
7 13 (7.43%) Visual Studio
8 10 (5.71%) Mockito
8 10 (5.71%) Team Foundation Server
9 9 (5.14%) CMake
9 9 (5.14%) TestRail
9 9 (5.14%) Trac
10 8 (4.57%) Cypress.io
10 8 (4.57%) SonarQube
11 7 (4.00%) Maven
11 7 (4.00%) Selenium
12 6 (3.43%) Cucumber
13 5 (2.86%) Postman
14 4 (2.29%) Zephyr
General
1 39 (22.29%) Social Skills
2 28 (16.00%) Aerospace
3 23 (13.14%) Analytical Skills
4 17 (9.71%) Public Sector
5 16 (9.14%) Telecoms
6 13 (7.43%) Finance
7 9 (5.14%) Organisational Skills
8 8 (4.57%) Electronics
9 7 (4.00%) Manufacturing
9 7 (4.00%) Marketing
9 7 (4.00%) Pharmaceutical
10 4 (2.29%) Banking
11 2 (1.14%) Health Technology
12 1 (0.57%) Automotive
12 1 (0.57%) Law
12 1 (0.57%) Presentation Skills
Job Titles
1 59 (33.71%) Developer
2 29 (16.57%) DevOps Engineer
3 28 (16.00%) Software Engineer
4 27 (15.43%) Java Developer
5 23 (13.14%) Senior
6 17 (9.71%) Full Stack Developer
7 16 (9.14%) .NET Developer
7 16 (9.14%) C# .NET Developer
7 16 (9.14%) C# Developer
7 16 (9.14%) Consultant
8 13 (7.43%) Software Consultant
9 12 (6.86%) Infrastructure Engineer
9 12 (6.86%) Senior Software Engineer
10 9 (5.14%) Azure DevOps Engineer
10 9 (5.14%) Azure Engineer
10 9 (5.14%) Systems Engineer
11 8 (4.57%) Full Stack Java Developer
12 7 (4.00%) Linux Engineer
13 6 (3.43%) Software Developer
14 5 (2.86%) AWS DevOps
Libraries, Frameworks & Software Standards
1 40 (22.86%) REST
2 37 (21.14%) HTML
3 36 (20.57%) .NET
4 34 (19.43%) Web Services
5 26 (14.86%) Spring
5 26 (14.86%) Spring Boot
6 20 (11.43%) RabbitMQ
6 20 (11.43%) XML
7 18 (10.29%) Apache Camel
8 16 (9.14%) AngularJS
8 16 (9.14%) MSMQ
9 15 (8.57%) Node.js
10 14 (8.00%) Elastic Stack
11 11 (6.29%) React
12 10 (5.71%) RESTful
13 9 (5.14%) HTML5
13 9 (5.14%) QML
13 9 (5.14%) Qt
13 9 (5.14%) VTK
13 9 (5.14%) WPF
Miscellaneous
1 21 (12.00%) Distributed Systems
2 13 (7.43%) Linux Command Line
3 11 (6.29%) Product Ownership
4 9 (5.14%) CUDA
4 9 (5.14%) Enterprise Software
5 5 (2.86%) Management Information System
5 5 (2.86%) PKI
6 4 (2.29%) Client/Server
7 3 (1.71%) Algorithms
7 3 (1.71%) Cloud Native
7 3 (1.71%) IoT
8 2 (1.14%) Data Centre
8 2 (1.14%) Embedded Systems
8 2 (1.14%) NB-IoT
8 2 (1.14%) Public Cloud
9 1 (0.57%) ARM Cortex
9 1 (0.57%) Enterprise Storage
9 1 (0.57%) Mobile App
9 1 (0.57%) Private Cloud
9 1 (0.57%) Renewable Energy
Operating Systems
1 47 (26.86%) Linux
2 20 (11.43%) Windows
3 10 (5.71%) Windows Server
4 8 (4.57%) CentOS
5 5 (2.86%) Red Hat Enterprise Linux
5 5 (2.86%) Windows 10
5 5 (2.86%) Windows Server 2012
5 5 (2.86%) Windows Server 2016
5 5 (2.86%) Windows Server 2019
6 2 (1.14%) Embedded Linux
6 2 (1.14%) Rocky
6 2 (1.14%) Ubuntu
Processes & Methodologies
1 96 (54.86%) CI/CD
2 93 (53.14%) DevOps
3 92 (52.57%) Agile
4 87 (49.71%) Problem-Solving
5 49 (28.00%) Microservices
6 47 (26.86%) TDD
7 37 (21.14%) Containerisation
8 36 (20.57%) Collaborative Working
8 36 (20.57%) Software Engineering
9 35 (20.00%) Software Testing
10 26 (14.86%) Scrum
11 25 (14.29%) Configuration Management
12 24 (13.71%) Actionable Insight
13 22 (12.57%) Full Stack Development
13 22 (12.57%) Unit Testing
14 21 (12.00%) Design Patterns
14 21 (12.00%) Kanban
15 19 (10.86%) BDD
16 18 (10.29%) Deployment Automation
16 18 (10.29%) Time Management
Programming Languages
1 64 (36.57%) Python
2 44 (25.14%) Java
3 43 (24.57%) C#
4 38 (21.71%) JavaScript
4 38 (21.71%) PowerShell
5 36 (20.57%) Bash
6 24 (13.71%) SQL
7 22 (12.57%) C
8 21 (12.00%) C++
9 13 (7.43%) TypeScript
10 10 (5.71%) Groovy
11 9 (5.14%) C-shell
11 9 (5.14%) Fortran
12 8 (4.57%) Shell Script
13 7 (4.00%) PHP
14 6 (3.43%) Perl
15 4 (2.29%) Go
16 3 (1.71%) Ruby
17 2 (1.14%) Assembly Language
18 1 (0.57%) VBScript
Qualifications
1 49 (28.00%) Security Cleared
2 47 (26.86%) SC Cleared
3 21 (12.00%) Degree
4 11 (6.29%) AWS Certification
5 8 (4.57%) Computer Science Degree
6 3 (1.71%) Master's Degree
6 3 (1.71%) PhD
7 2 (1.14%) AWS Certified DevOps Engineer
8 1 (0.57%) Azure Certification
8 1 (0.57%) DV Cleared
8 1 (0.57%) ISTQB
Quality Assurance & Compliance
1 17 (9.71%) QA
2 3 (1.71%) GDPR
2 3 (1.71%) PCI DSS
3 1 (0.57%) HIPAA
System Software
1 90 (51.43%) Docker
2 19 (10.86%) Active Directory
2 19 (10.86%) Hyper-V
3 9 (5.14%) NFS
3 9 (5.14%) pfSense
3 9 (5.14%) Virtual Machines
4 8 (4.57%) VMware Infrastructure
5 5 (2.86%) Citrix Hypervisor
6 4 (2.29%) Firmware
7 2 (1.14%) Embedded Firmware
7 2 (1.14%) KVM
7 2 (1.14%) QEMU
7 2 (1.14%) Xen
8 1 (0.57%) VMware ESXi
Systems Management
1 93 (53.14%) Kubernetes
2 53 (30.29%) Ansible
3 42 (24.00%) Terraform
4 16 (9.14%) Grafana
5 10 (5.71%) Kibana
5 10 (5.71%) ZABBIX
6 9 (5.14%) Microsoft Data Protection Manager
6 9 (5.14%) SCDPM
7 8 (4.57%) Puppet
8 5 (2.86%) Prometheus
8 5 (2.86%) Red Hat Spacewalk
8 5 (2.86%) Single Sign-On
9 4 (2.29%) HP Quality Center
10 2 (1.14%) Consul
10 2 (1.14%) Progress Chef
11 1 (0.57%) Graphite
11 1 (0.57%) Nagios
11 1 (0.57%) NetBackup
11 1 (0.57%) Rundeck
11 1 (0.57%) Salt
Vendors
1 32 (18.29%) Microsoft
2 22 (12.57%) VMware
3 14 (8.00%) Fortinet
3 14 (8.00%) Juniper
3 14 (8.00%) ServiceNow
4 12 (6.86%) Splunk
5 11 (6.29%) Red Hat
6 10 (5.71%) Dynatrace
6 10 (5.71%) WSO2
7 9 (5.14%) McAfee
7 9 (5.14%) Oracle
7 9 (5.14%) Veeam
8 7 (4.00%) SAP
9 6 (3.43%) Google
10 5 (2.86%) Cisco
11 4 (2.29%) HP
12 2 (1.14%) Atmel
12 2 (1.14%) Freescale
12 2 (1.14%) Talend
13 1 (0.57%) New Relic