JIRA Contracts in the City of London

Atlassian JIRA
Central London > City of London

The following table provides summary statistics for contract job vacancies advertised in the City of London with a requirement for JIRA skills. Included is a benchmarking guide to the contractor rates offered in vacancies that have cited JIRA over the 6 months to 18 May 2024 with a comparison to the same period in the previous 2 years.

6 months to
18 May 2024
Same period 2023 Same period 2022
Rank 49 50 28
Rank change year-on-year +1 -22 +24
Contract jobs citing JIRA 84 154 284
As % of all contract jobs advertised in the City of London 3.88% 4.37% 6.75%
As % of the Development Applications category 29.79% 30.14% 31.70%
Number of daily rates quoted 51 119 205
10th Percentile £363 £423 £413
25th Percentile £448 £503 £475
Median daily rate (50th Percentile) £501 £600 £565
Median % change year-on-year -16.50% +6.19% +2.73%
75th Percentile £586 £700 £650
90th Percentile £688 £790 £713
Central London median daily rate £501 £550 £550
% change year-on-year -8.91% - +6.85%

All Development Application Skills
City of London

JIRA is in the Development Applications category. The following table is for comparison with the above and provides summary statistics for all contract job vacancies advertised in the City of London with a requirement for development application skills.

Contract vacancies with a requirement for development application skills 282 511 896
As % of all contract IT jobs advertised in the City of London 13.03% 14.49% 21.30%
Number of daily rates quoted 190 337 708
10th Percentile £400 £425 £425
25th Percentile £463 £505 £500
Median daily rate (50th Percentile) £550 £601 £588
Median % change year-on-year -8.41% +2.21% +9.30%
75th Percentile £673 £750 £707
90th Percentile £750 £800 £788
Central London median daily rate £550 £600 £580
% change year-on-year -8.33% +3.45% +10.48%
Number of hourly rates quoted 1 5 1
10th Percentile - - -
25th Percentile £46.75 £35.00 £66.25
Median hourly rate £48.50 £52.50 £72.50
Median % change year-on-year -7.62% -27.59% +150.00%
75th Percentile £50.25 £58.75 £78.75
90th Percentile - - -
Central London median hourly rate £40.75 £52.50 £72.50
% change year-on-year -22.38% -27.59% +150.00%

JIRA
Job Vacancy Trend in the City of London

Job postings citing JIRA as a proportion of all IT jobs advertised in the City of London.
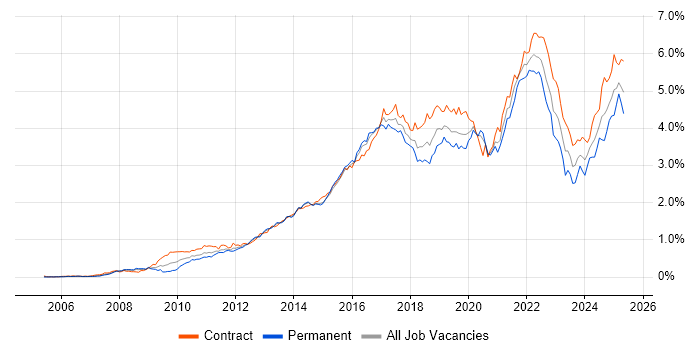
Job vacancy trend for JIRA in the City of London

JIRA
Contractor Daily Rate Trend in the City of London

3-month moving average daily rate quoted in jobs citing JIRA in the City of London.

Daily rate trend for JIRA in the City of London

JIRA
Daily Rate Histogram in the City of London

Daily rate distribution for jobs citing JIRA in the City of London over the 6 months to 18 May 2024.

Daily rate histogram for JIRA in the City of London

JIRA
Contractor Hourly Rate Trend in the City of London

3-month moving average hourly rates quoted in jobs citing JIRA in the City of London.

Hourly rate trend for JIRA in the City of London

JIRA
Co-occurring Skills and Capabilities in the City of London by Category

The follow tables expand on the table above by listing co-occurrences grouped by category. The same employment type, locality and period is covered with up to 20 co-occurrences shown in each of the following categories:

Application Platforms
1 28 (33.33%) Confluence
2 5 (5.95%) IIS
3 2 (2.38%) nginx
4 1 (1.19%) CMS
4 1 (1.19%) JBoss
Applications
1 3 (3.57%) Microsoft Project
2 2 (2.38%) Microsoft Office
2 2 (2.38%) Microsoft PowerPoint
3 1 (1.19%) Microsoft Excel
Business Applications
1 1 (1.19%) Loan IQ
1 1 (1.19%) Salesforce CRM
Cloud Services
1 13 (15.48%) Azure
2 7 (8.33%) Azure DevOps
3 5 (5.95%) AWS
3 5 (5.95%) GitHub
4 4 (4.76%) GCP
5 3 (3.57%) BrowserStack
6 2 (2.38%) Cloud Computing
6 2 (2.38%) Dynamics 365
6 2 (2.38%) Miro
6 2 (2.38%) SaaS
6 2 (2.38%) Sauce Labs
6 2 (2.38%) Slack
6 2 (2.38%) WhatsApp
7 1 (1.19%) Amazon EC2
7 1 (1.19%) Azure Service Bus
7 1 (1.19%) Microsoft 365
7 1 (1.19%) Power Platform
7 1 (1.19%) SAP Commerce Cloud
7 1 (1.19%) Smartsheet
7 1 (1.19%) SuccessFactors
Communications & Networking
1 4 (4.76%) Internet
2 3 (3.57%) TCP/IP
3 2 (2.38%) DNS
3 2 (2.38%) Firewall
4 1 (1.19%) DHCP
4 1 (1.19%) FTP
4 1 (1.19%) MQTT
4 1 (1.19%) Remote Desktop
4 1 (1.19%) VLAN
4 1 (1.19%) VoIP
4 1 (1.19%) VPN
4 1 (1.19%) Wireless
Database & Business Intelligence
1 9 (10.71%) SQL Server
2 3 (3.57%) PostgreSQL
3 2 (2.38%) Metadata
3 2 (2.38%) MongoDB
3 2 (2.38%) NoSQL
3 2 (2.38%) Relational Database
4 1 (1.19%) Amazon Redshift
4 1 (1.19%) Apache Cassandra
4 1 (1.19%) BigQuery
4 1 (1.19%) BusinessObjects
4 1 (1.19%) CouchDB
4 1 (1.19%) Data Mart
4 1 (1.19%) Data Warehouse
4 1 (1.19%) Elasticsearch
4 1 (1.19%) Enterprise Data Warehouse
4 1 (1.19%) MySQL
4 1 (1.19%) Power BI
4 1 (1.19%) Redis
4 1 (1.19%) Tableau
Development Applications
1 14 (16.67%) Git
2 7 (8.33%) Jenkins
2 7 (8.33%) Selenium
3 5 (5.95%) JMeter
4 4 (4.76%) Bitbucket
5 3 (3.57%) Appium
6 2 (2.38%) Cucumber
6 2 (2.38%) GitLab
6 2 (2.38%) JUnit
6 2 (2.38%) Postman
7 1 (1.19%) Bugzilla
7 1 (1.19%) Cypress.io
7 1 (1.19%) Eclipse
7 1 (1.19%) IntelliJ
7 1 (1.19%) Maven
7 1 (1.19%) SoapUI
7 1 (1.19%) SpecFlow
7 1 (1.19%) Team Foundation Server
7 1 (1.19%) Visual Studio
7 1 (1.19%) Visual Studio Team System
General
1 25 (29.76%) Social Skills
2 16 (19.05%) Finance
3 10 (11.90%) Analytical Skills
4 7 (8.33%) Banking
5 4 (4.76%) Influencing Skills
5 4 (4.76%) Presentation Skills
5 4 (4.76%) Public Sector
5 4 (4.76%) Retail
6 3 (3.57%) Marketing
7 2 (2.38%) Front Office
7 2 (2.38%) Investment Banking
7 2 (2.38%) Organisational Skills
7 2 (2.38%) Public Speaking
7 2 (2.38%) Telecoms
8 1 (1.19%) Aviation
8 1 (1.19%) Back Office
8 1 (1.19%) Documentation Skills
8 1 (1.19%) Financial Institution
8 1 (1.19%) Legal
Job Titles
1 14 (16.67%) Analyst
2 9 (10.71%) Project Manager
3 6 (7.14%) Lead
4 5 (5.95%) Business Analyst
4 5 (5.95%) Developer
4 5 (5.95%) Senior
4 5 (5.95%) Software Engineer
4 5 (5.95%) Test Analyst
5 4 (4.76%) Programme Manager
5 4 (4.76%) Test Manager
6 3 (3.57%) Test Leader
7 2 (2.38%) Mac Engineer
7 2 (2.38%) PMO Analyst
7 2 (2.38%) Product Owner
7 2 (2.38%) Risk Project Manager
7 2 (2.38%) Senior Analyst
7 2 (2.38%) Senior Mac Engineer
7 2 (2.38%) Service Design Manager
7 2 (2.38%) Service Transition Manager
7 2 (2.38%) Technical Manager
Libraries, Frameworks & Software Standards
1 11 (13.10%) .NET
2 7 (8.33%) ADO
3 6 (7.14%) Web Services
4 5 (5.95%) .NET Core
5 4 (4.76%) .NET Framework
5 4 (4.76%) ASP.NET
5 4 (4.76%) HTML
6 3 (3.57%) CSS
6 3 (3.57%) Spring
6 3 (3.57%) XML
7 2 (2.38%) AngularJS
7 2 (2.38%) REST
8 1 (1.19%) Android Jetpack
8 1 (1.19%) Elastic Stack
8 1 (1.19%) Jetpack Compose
8 1 (1.19%) React
8 1 (1.19%) SailPoint
8 1 (1.19%) Spring Boot
8 1 (1.19%) Svelte
8 1 (1.19%) WebdriverIO
Miscellaneous
1 9 (10.71%) Product Ownership
2 2 (2.38%) Fixed Income
2 2 (2.38%) Management Information System
3 1 (1.19%) BYOD
3 1 (1.19%) CBDC
3 1 (1.19%) CMDB
3 1 (1.19%) Credit Risk
3 1 (1.19%) Digital Currency
3 1 (1.19%) Enterprise Software
3 1 (1.19%) Foreign Exchange (FX)
3 1 (1.19%) IVR
3 1 (1.19%) Legacy Systems
3 1 (1.19%) Linux Command Line
3 1 (1.19%) Machine to Machine
3 1 (1.19%) Mobile App
3 1 (1.19%) Onboarding
3 1 (1.19%) Online Banking
3 1 (1.19%) PDA
3 1 (1.19%) PKI
3 1 (1.19%) W3C
Operating Systems
1 12 (14.29%) Windows
2 6 (7.14%) Linux
3 4 (4.76%) Windows Server
4 3 (3.57%) Android
4 3 (3.57%) Mac OS
4 3 (3.57%) Unix
5 2 (2.38%) Mac OS X
5 2 (2.38%) Windows 10
6 1 (1.19%) Apple iOS
6 1 (1.19%) Windows Server 2012
6 1 (1.19%) Windows Server 2016
6 1 (1.19%) Windows Server 2019
Processes & Methodologies
1 49 (58.33%) Agile
2 21 (25.00%) Scrum
3 14 (16.67%) DevOps
4 13 (15.48%) Project Management
5 12 (14.29%) CI/CD
5 12 (14.29%) Kanban
5 12 (14.29%) SDLC
5 12 (14.29%) Stakeholder Management
5 12 (14.29%) Test Automation
6 11 (13.10%) Problem-Solving
6 11 (13.10%) Scaled Agile Framework
7 10 (11.90%) Waterfall
8 8 (9.52%) Programme Management
8 8 (9.52%) Software Engineering
9 7 (8.33%) Collaborative Working
10 6 (7.14%) Acceptance Criteria
10 6 (7.14%) API Management
10 6 (7.14%) Continuous Improvement
10 6 (7.14%) Manual Testing
10 6 (7.14%) Microservices
Programming Languages
1 13 (15.48%) C#
2 12 (14.29%) Java
3 8 (9.52%) SQL
4 7 (8.33%) C++
4 7 (8.33%) Python
5 4 (4.76%) JavaScript
6 2 (2.38%) PowerShell
7 1 (1.19%) Bash
7 1 (1.19%) C
7 1 (1.19%) Go
7 1 (1.19%) Kotlin
7 1 (1.19%) Perl
7 1 (1.19%) Ruby
7 1 (1.19%) Rust
7 1 (1.19%) Shell Script
Qualifications
1 8 (9.52%) Degree
2 6 (7.14%) SC Cleared
2 6 (7.14%) Security Cleared
3 5 (5.95%) ISTQB
4 4 (4.76%) PMI Certification
4 4 (4.76%) PMP
5 3 (3.57%) ISEB
6 2 (2.38%) ISTQB Foundation Certification
7 1 (1.19%) Azure Certification
7 1 (1.19%) Computer Science Degree
7 1 (1.19%) Master's Degree
7 1 (1.19%) MBA
7 1 (1.19%) SANS
Quality Assurance & Compliance
1 14 (16.67%) QA
2 9 (10.71%) PMO
3 2 (2.38%) Accessibility
3 2 (2.38%) NIST
4 1 (1.19%) Data Quality
4 1 (1.19%) GDPR
4 1 (1.19%) ISO 20022
4 1 (1.19%) ISO/IEC 27001
4 1 (1.19%) PCI DSS
System Software
1 3 (3.57%) VMware Infrastructure
2 2 (2.38%) Active Directory
2 2 (2.38%) Docker
2 2 (2.38%) vSphere
3 1 (1.19%) iptables
3 1 (1.19%) Virtual Machines
Systems Management
1 4 (4.76%) Ansible
2 3 (3.57%) Terraform
3 2 (2.38%) Grafana
3 2 (2.38%) Kibana
3 2 (2.38%) Kubernetes
3 2 (2.38%) logstash
3 2 (2.38%) Packer
3 2 (2.38%) Prometheus
4 1 (1.19%) Consul
4 1 (1.19%) Docker Swarm
4 1 (1.19%) HP Quality Center
4 1 (1.19%) Opsgenie
4 1 (1.19%) Progress Chef
4 1 (1.19%) Puppet
4 1 (1.19%) SCCM
4 1 (1.19%) WSUS
Vendors
1 10 (11.90%) Microsoft
2 9 (10.71%) Oracle
3 7 (8.33%) ServiceNow
4 5 (5.95%) Atlassian
5 3 (3.57%) Apple
5 3 (3.57%) Google
5 3 (3.57%) VMware
6 2 (2.38%) Cisco
6 2 (2.38%) Dell
6 2 (2.38%) Okta
6 2 (2.38%) Perfecto Mobile
6 2 (2.38%) Splunk
7 1 (1.19%) Arista
7 1 (1.19%) CA Agile Central
7 1 (1.19%) Citrix
7 1 (1.19%) Dynatrace
7 1 (1.19%) Genesys
7 1 (1.19%) IBM
7 1 (1.19%) PagerDuty
7 1 (1.19%) Red Hat