Linux Contract Job Trends in the City of London

Linux
Central London > City of London

The table below provides summary statistics and contractor rates for jobs advertised in the City of London requiring Linux skills. It covers vacancies from the 6 months leading up to 1 September 2025, with comparisons to the same periods in the previous two years.

6 months to
1 Sep 2025
Same period 2024 Same period 2023
Rank 47 31 33
Rank change year-on-year -16 +2 +1
Contract jobs citing Linux 84 114 190
As % of all contract jobs advertised in the City of London 4.67% 5.47% 6.05%
As % of the Operating Systems category 42.64% 40.28% 44.08%
Number of daily rates quoted 70 74 125
10th Percentile £400 £392 £400
25th Percentile £503 £455 £475
Median daily rate (50th Percentile) £631 £625 £600
Median % change year-on-year +1.00% +4.17% -
75th Percentile £688 £710 £700
90th Percentile £775 £775 £750
Central London median daily rate £638 £625 £603
% change year-on-year +2.00% +3.69% +0.46%
Number of hourly rates quoted 1 0 1
10th Percentile - - -
25th Percentile £26.25 - £47.50
Median hourly rate £27.50 - £50.00
75th Percentile £28.75 - £52.50
90th Percentile - - -
Central London median hourly rate £27.50 - £50.00
% change year-on-year - - +20.48%

All Operating Systems
City of London

Linux falls under the Operating Systems category. For comparison with the information above, the following table provides summary statistics for all contract job vacancies requiring operating system skills in the City of London.

Contract vacancies with a requirement for operating system skills 197 283 431
As % of all contract IT jobs advertised in the City of London 10.94% 13.58% 13.72%
Number of daily rates quoted 143 187 295
10th Percentile £258 £250 £172
25th Percentile £350 £379 £350
Median daily rate (50th Percentile) £525 £525 £525
Median % change year-on-year - - +3.91%
75th Percentile £675 £648 £638
90th Percentile £733 £725 £725
Central London median daily rate £496 £500 £501
% change year-on-year -0.90% -0.10% +0.10%
Number of hourly rates quoted 3 3 2
10th Percentile £24.25 £23.90 £23.88
25th Percentile £25.00 £25.06 £27.81
Median hourly rate £27.50 £27.00 £36.25
Median % change year-on-year +1.85% -25.52% +76.83%
75th Percentile £29.50 £28.19 £45.31
90th Percentile £29.95 £28.90 £49.63
Central London median hourly rate £26.00 £27.00 £36.25
% change year-on-year -3.70% -25.52% +76.83%

Linux
Job Vacancy Trend in the City of London

Job postings citing Linux as a proportion of all IT jobs advertised in the City of London.
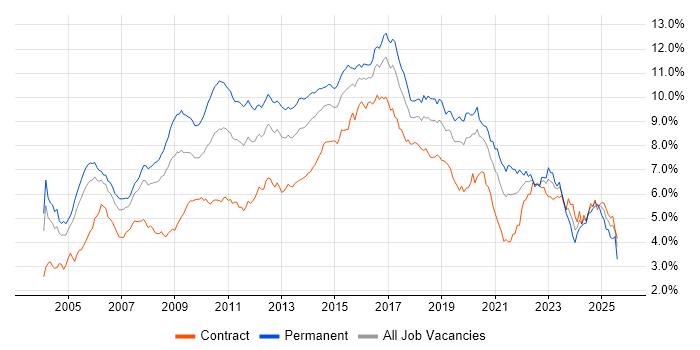
Job vacancy trend for Linux in the City of London

Linux
Daily Rate Trend in the City of London

Contractor daily rate distribution trend for jobs in the City of London citing Linux.

Contractor daily rate distribution trend for jobs in the City of London citing Linux

Linux
Daily Rate Histogram in the City of London

Daily rate distribution for jobs citing Linux in the City of London over the 6 months to 1 September 2025.

Daily rate histogram for Linux in the City of London

Linux
Hourly Rate Trend in the City of London

Contractor hourly rate distribution trend for jobs in the City of London citing Linux.

Contractor hourly rate distribution trend for jobs in the City of London citing Linux

Linux
Contract Job Locations in the City of London

The table below looks at the demand and provides a guide to the median contractor rates quoted in IT jobs citing Linux within the City of London region over the 6 months to 1 September 2025. The 'Rank Change' column provides an indication of the change in demand within each location based on the same 6 month period last year.

Location Rank Change
on Same Period
Last Year
Matching
Contract
IT Job Ads
Median
Daily Rate
Past 6 Months
Median Daily Rate
% Change
on Same Period
Last Year
Live
Jobs
Moorgate - 1 £390 -
Linux
Central London

Linux
Co-occurring Skills and Capabilities in the City of London by Category

The follow tables expand on the table above by listing co-occurrences grouped by category. The same employment type, locality and period is covered with up to 20 co-occurrences shown in each of the following categories:

Application Platforms
1 4 (4.76%) SAS
2 3 (3.57%) Apache
2 3 (3.57%) Apache Spark
2 3 (3.57%) Confluence
3 2 (2.38%) IIS
3 2 (2.38%) Jupyter
4 1 (1.19%) CICS
4 1 (1.19%) JBoss
4 1 (1.19%) nginx
4 1 (1.19%) OpenStack
4 1 (1.19%) Oracle Workflow
Business Applications
1 1 (1.19%) Oracle Procure-to-Pay
1 1 (1.19%) Temenos T24
Cloud Services
1 13 (15.48%) AWS
1 13 (15.48%) Azure
2 5 (5.95%) GCP
3 4 (4.76%) AWS CloudFormation
4 3 (3.57%) IaaS
4 3 (3.57%) OpenShift
4 3 (3.57%) PaaS
4 3 (3.57%) SaaS
5 2 (2.38%) Amazon EC2
5 2 (2.38%) Amazon S3
5 2 (2.38%) Cloud Computing
5 2 (2.38%) GitHub
5 2 (2.38%) Microsoft 365
5 2 (2.38%) Power Platform
5 2 (2.38%) Virtual Private Cloud
6 1 (1.19%) Amazon ECS
6 1 (1.19%) Amazon EKS
6 1 (1.19%) Azure DevOps
6 1 (1.19%) Azure Sentinel
6 1 (1.19%) Serverless
Communications & Networking
1 11 (13.10%) Firewall
2 5 (5.95%) HTTP
3 4 (4.76%) SAN
4 3 (3.57%) DNS
4 3 (3.57%) SSH
4 3 (3.57%) SSL
4 3 (3.57%) TCP/IP
4 3 (3.57%) WAN
5 2 (2.38%) LAN
5 2 (2.38%) Multicast
5 2 (2.38%) NAS
5 2 (2.38%) tcpdump
5 2 (2.38%) VPN
6 1 (1.19%) Ethernet
6 1 (1.19%) HTTPS
6 1 (1.19%) Internet
6 1 (1.19%) Network Security
6 1 (1.19%) Wi-Fi
Database & Business Intelligence
1 11 (13.10%) SQL Server
2 6 (7.14%) Relational Database
3 5 (5.95%) Elasticsearch
3 5 (5.95%) KDB
4 4 (4.76%) Data Warehouse
5 3 (3.57%) Azure SQL Database
5 3 (3.57%) Base SAS
5 3 (3.57%) Metadata
5 3 (3.57%) Oracle Database
5 3 (3.57%) PostgreSQL
6 2 (2.38%) Apache Hive
6 2 (2.38%) Delta Lake
6 2 (2.38%) MongoDB
6 2 (2.38%) MySQL
6 2 (2.38%) Oracle Exadata
6 2 (2.38%) Power BI
7 1 (1.19%) Big Data
7 1 (1.19%) DB2
7 1 (1.19%) Hadoop
7 1 (1.19%) Redis
Development Applications
1 19 (22.62%) Jenkins
2 11 (13.10%) Git
3 5 (5.95%) JIRA
4 4 (4.76%) JUnit
5 3 (3.57%) Artifactory
5 3 (3.57%) Atlassian Bamboo
5 3 (3.57%) Bitbucket Server
5 3 (3.57%) GitLab
6 2 (2.38%) Eclipse
6 2 (2.38%) IntelliJ
6 2 (2.38%) JMeter
6 2 (2.38%) Robot Framework
6 2 (2.38%) RStudio
7 1 (1.19%) Cucumber
7 1 (1.19%) Cypress.io
7 1 (1.19%) Hamcrest
7 1 (1.19%) LoadRunner
7 1 (1.19%) Selenium
7 1 (1.19%) Subversion
7 1 (1.19%) TeamCity
General
1 42 (50.00%) Finance
2 30 (35.71%) Social Skills
3 18 (21.43%) Analytical Skills
4 13 (15.48%) Banking
5 8 (9.52%) Financial Institution
5 8 (9.52%) Front Office
5 8 (9.52%) Investment Banking
6 4 (4.76%) International Banking
7 2 (2.38%) Advertising
7 2 (2.38%) Public Sector
8 1 (1.19%) Back Office
8 1 (1.19%) Inclusion and Diversity
8 1 (1.19%) Influencing Skills
8 1 (1.19%) Presentation Skills
8 1 (1.19%) Retail Banking
Job Titles
1 16 (19.05%) Developer
2 7 (8.33%) Java Developer
2 7 (8.33%) Software Engineer
3 6 (7.14%) Analyst
4 5 (5.95%) Applications Engineer
4 5 (5.95%) Senior
5 4 (4.76%) Architect
5 4 (4.76%) C++ Software Engineer
5 4 (4.76%) DevOps Engineer
5 4 (4.76%) Python Engineer
6 3 (3.57%) Administrator
6 3 (3.57%) Backup Engineer
6 3 (3.57%) Data Engineer
6 3 (3.57%) Infrastructure Engineer
6 3 (3.57%) Linux Engineer
6 3 (3.57%) Operations Analyst
6 3 (3.57%) Platform Engineer
6 3 (3.57%) Security Analyst
6 3 (3.57%) Security Engineer
6 3 (3.57%) Security Operations Analyst
Libraries, Frameworks & Software Standards
1 11 (13.10%) FIX Protocol
2 6 (7.14%) Elastic Stack
2 6 (7.14%) Spring
3 4 (4.76%) Middleware
3 4 (4.76%) RESTful
4 3 (3.57%) JSON
4 3 (3.57%) Kafka
4 3 (3.57%) YAML
5 2 (2.38%) Loki
5 2 (2.38%) pydantic
5 2 (2.38%) PySpark
5 2 (2.38%) RabbitMQ
5 2 (2.38%) WebSockets
6 1 (1.19%) AngularJS
6 1 (1.19%) Node.js
6 1 (1.19%) OAuth
6 1 (1.19%) OpenTelemetry
6 1 (1.19%) React
6 1 (1.19%) REST
6 1 (1.19%) WireMock
Miscellaneous
1 11 (13.10%) Fixed Income
2 10 (11.90%) Foreign Exchange (FX)
3 9 (10.71%) Cloud Native
3 9 (10.71%) Distributed Systems
4 8 (9.52%) Data Centre
5 6 (7.14%) Algorithms
6 5 (5.95%) Data Structures
6 5 (5.95%) Linux Command Line
6 5 (5.95%) Replication
7 4 (4.76%) Reference Data
8 3 (3.57%) Cyber Threat
8 3 (3.57%) Distributed Denial-of-Service
8 3 (3.57%) Onboarding
8 3 (3.57%) Private Cloud
9 2 (2.38%) Distributed Applications
9 2 (2.38%) Distributed Architecture
9 2 (2.38%) Distributed Computing
9 2 (2.38%) Enterprise Software
9 2 (2.38%) Hedge funds
9 2 (2.38%) Virtual Team
Operating Systems
1 25 (29.76%) Windows
2 23 (27.38%) Unix
3 7 (8.33%) Red Hat Enterprise Linux
4 5 (5.95%) Windows Server
5 1 (1.19%) AIX
5 1 (1.19%) CentOS
5 1 (1.19%) Solaris
5 1 (1.19%) VMS
Processes & Methodologies
1 22 (26.19%) DevOps
1 22 (26.19%) Problem-Solving
2 20 (23.81%) CI/CD
3 19 (22.62%) Low Latency
4 16 (19.05%) Agile
5 15 (17.86%) Software Engineering
6 14 (16.67%) Electronic Trading
7 13 (15.48%) Infrastructure as Code
8 12 (14.29%) Containerisation
9 11 (13.10%) Project Management
10 9 (10.71%) Computer Science
10 9 (10.71%) Scrum
11 8 (9.52%) Algorithmic Trading
11 8 (9.52%) Data Pipeline
11 8 (9.52%) Event-Driven
11 8 (9.52%) High Availability
11 8 (9.52%) Migration
11 8 (9.52%) Observability
11 8 (9.52%) Performance Tuning
12 7 (8.33%) Infrastructure Management
Programming Languages
1 40 (47.62%) Python
2 19 (22.62%) Java
3 15 (17.86%) Bash
4 13 (15.48%) SQL
5 11 (13.10%) PowerShell
6 9 (10.71%) C++
7 6 (7.14%) Shell Script
8 3 (3.57%) Go
8 3 (3.57%) Perl
8 3 (3.57%) Scala
9 2 (2.38%) AWK
9 2 (2.38%) C
9 2 (2.38%) C#
9 2 (2.38%) JavaScript
9 2 (2.38%) PROC SQL
9 2 (2.38%) R
9 2 (2.38%) SAS Macro
9 2 (2.38%) sed
10 1 (1.19%) COBOL
10 1 (1.19%) MATLAB
Qualifications
1 13 (15.48%) Degree
2 9 (10.71%) SC Cleared
2 9 (10.71%) Security Cleared
3 6 (7.14%) Computer Science Degree
4 3 (3.57%) ITIL Certification
5 2 (2.38%) AWS Certification
5 2 (2.38%) AWS Certified Developer
5 2 (2.38%) AWS Certified DevOps Engineer
5 2 (2.38%) AWS Certified Solutions Architect
5 2 (2.38%) AWS Certified SysOps Administrator
5 2 (2.38%) MCITP
5 2 (2.38%) Microsoft Certification
5 2 (2.38%) Postgraduate
6 1 (1.19%) (ISC)2 CCSP
6 1 (1.19%) Azure Certification
6 1 (1.19%) BPSS Clearance
6 1 (1.19%) CompTIA Security+
6 1 (1.19%) GCIA
6 1 (1.19%) GCIH
6 1 (1.19%) Master's Degree
Quality Assurance & Compliance
1 2 (2.38%) GDPR
1 2 (2.38%) ISO/IEC 27001
1 2 (2.38%) QA
1 2 (2.38%) SLA
2 1 (1.19%) Accessibility
2 1 (1.19%) Data Quality
2 1 (1.19%) NIST
System Software
1 15 (17.86%) Docker
2 5 (5.95%) Active Directory
3 2 (2.38%) GPFS
3 2 (2.38%) Hyper-V
3 2 (2.38%) NFS
4 1 (1.19%) Slurm Workload Manager
4 1 (1.19%) Virtual Desktop
4 1 (1.19%) VMware Infrastructure
Systems Management
1 18 (21.43%) Kubernetes
2 13 (15.48%) Terraform
3 11 (13.10%) Ansible
4 7 (8.33%) Grafana
4 7 (8.33%) ITRS Geneos
5 5 (5.95%) Kibana
5 5 (5.95%) logstash
6 4 (4.76%) Prometheus
7 3 (3.57%) Argo
7 3 (3.57%) NetBackup
7 3 (3.57%) Progress Chef
7 3 (3.57%) Puppet
7 3 (3.57%) Tivoli Storage Manager
8 2 (2.38%) Kustomize
8 2 (2.38%) Microsoft Intune
8 2 (2.38%) Oracle Enterprise Manager
8 2 (2.38%) Packer
8 2 (2.38%) Podman
8 2 (2.38%) SCOM
9 1 (1.19%) Single Sign-On
Vendors
1 9 (10.71%) Microsoft
2 8 (9.52%) Oracle
2 8 (9.52%) Red Hat
3 6 (7.14%) Splunk
4 5 (5.95%) Solace
4 5 (5.95%) VMware
5 4 (4.76%) HP
6 3 (3.57%) Databricks
6 3 (3.57%) F5
6 3 (3.57%) IBM
6 3 (3.57%) Veeam
7 2 (2.38%) Cisco
7 2 (2.38%) Citrix
7 2 (2.38%) ION Trading
7 2 (2.38%) ServiceNow
7 2 (2.38%) Tenable
8 1 (1.19%) Dell
8 1 (1.19%) Hitachi
8 1 (1.19%) Murex
8 1 (1.19%) NetApp