Hybrid/Remote Design Patterns Job Trends

Design Patterns
UK > Work from Home

The table below provides summary statistics and salary benchmarking for remote or hybrid work requiring Design Patterns skills. It covers permanent job vacancies from the 6 months leading up to 23 November 2025, with comparisons to the same periods in the previous two years.

6 months to
23 Nov 2025
Same period 2024 Same period 2023
Rank 195 132 147
Rank change year-on-year -63 +15 +6
Permanent jobs citing Design Patterns 190 480 504
As % of all permanent jobs with remote/hybrid work options 1.25% 2.37% 2.36%
As % of the Processes & Methodologies category 1.37% 2.66% 2.48%
Number of salaries quoted 143 259 413
10th Percentile £45,909 £42,319 £45,000
25th Percentile £57,500 £53,688 £51,500
Median annual salary (50th Percentile) £75,000 £67,500 £65,000
Median % change year-on-year +11.11% +3.85% -9.09%
75th Percentile £86,250 £83,750 £82,500
90th Percentile £100,000 £95,250 £97,087
UK median annual salary £77,500 £70,000 £65,000
% change year-on-year +10.71% +7.69% -13.33%

All Process and Methodology Skills
Work from Home

Design Patterns falls under the Processes and Methodologies category. For comparison with the information above, the following table provides summary statistics for all permanent job vacancies with remote or hybrid options requiring process or methodology skills.

Permanent vacancies with a requirement for process or methodology skills 13,868 18,074 20,283
As % of all permanent jobs with a WFH option 91.21% 89.24% 94.95%
Number of salaries quoted 8,727 10,941 16,424
10th Percentile £29,500 £36,250 £36,500
25th Percentile £40,000 £46,250 £46,306
Median annual salary (50th Percentile) £57,500 £62,500 £62,500
Median % change year-on-year -8.00% - -
75th Percentile £77,500 £81,250 £80,070
90th Percentile £97,500 £100,000 £97,500
UK median annual salary £55,000 £60,000 £60,000
% change year-on-year -8.33% - -

Design Patterns
Job Vacancy Trend for Remote/Hybrid Jobs

Historical trend showing the proportion of permanent IT job postings citing Design Patterns and offering remote or hybrid work options relative to all permanent IT jobs advertised.

Design Patterns job vacancy trend for remote/hybrid jobs

Design Patterns
Salary Trend for Remote/Hybrid Jobs

Salary distribution trend for jobs with remote/hybrid work options citing Design Patterns.
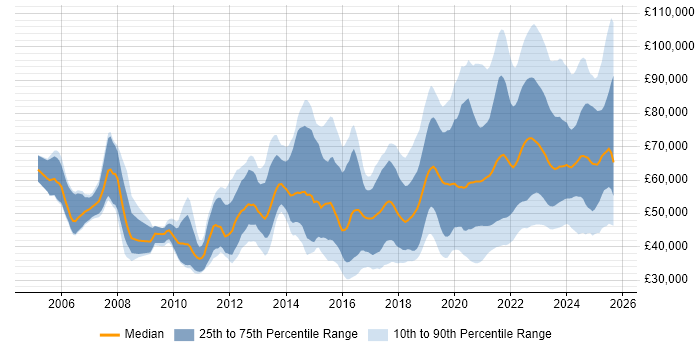
Salary distribution trend for jobs with remote/hybrid work options citing Design Patterns

Design Patterns
Salary Histogram for Remote/Hybrid Jobs

Salary distribution for jobs with remote/hybrid work options citing Design Patterns over the 6 months to 23 November 2025.

Design Patterns salary histogram for jobs with remote/hybrid work options

Design Patterns
Co-Occurring Skills & Capabilities in Remote/Hybrid Jobs by Category

The following tables expand on the one above by listing co-occurrences grouped by category. They cover the same employment type, locality and period, with up to 20 co-occurrences shown in each category:

Application Platforms
1 7 (3.68%) Ethereum
2 2 (1.05%) Apache Airflow
2 2 (1.05%) Apache Spark
2 2 (1.05%) Luigi
3 1 (0.53%) Apache
3 1 (0.53%) CMS
3 1 (0.53%) IIS
3 1 (0.53%) Kentico
3 1 (0.53%) NServiceBus
Applications
1 2 (1.05%) Adobe XD
1 2 (1.05%) Sketch
2 1 (0.53%) Microsoft Excel
2 1 (0.53%) Microsoft Office
2 1 (0.53%) Microsoft PowerPoint
2 1 (0.53%) MS Visio
2 1 (0.53%) PlantUML
Business Applications
1 2 (1.05%) Dynamics CRM
2 1 (0.53%) Magento
Cloud Services
1 94 (49.47%) Azure
2 61 (32.11%) AWS
3 45 (23.68%) Azure DevOps
4 37 (19.47%) GitHub
5 33 (17.37%) SaaS
6 24 (12.63%) Serverless
7 19 (10.00%) Power Platform
8 15 (7.89%) Dynamics 365
8 15 (7.89%) GCP
9 14 (7.37%) Power Automate
10 13 (6.84%) GitHub Actions
10 13 (6.84%) PaaS
11 11 (5.79%) Azure App Service
11 11 (5.79%) Entra ID
12 6 (3.16%) Figma
13 5 (2.63%) Azure Cosmos DB
13 5 (2.63%) Azure Service Bus
13 5 (2.63%) SonarCloud
14 4 (2.11%) AWS Lambda
14 4 (2.11%) Azure Data Factory
Communications & Networking
1 16 (8.42%) Broadband
2 1 (0.53%) S/MIME
2 1 (0.53%) SSL
2 1 (0.53%) X.509
Database & Business Intelligence
1 42 (22.11%) SQL Server
2 20 (10.53%) NoSQL
3 12 (6.32%) MongoDB
4 11 (5.79%) Elasticsearch
5 9 (4.74%) Relational Database
6 8 (4.21%) PostgreSQL
7 5 (2.63%) Power BI
8 4 (2.11%) Data Lake
9 3 (1.58%) Amazon RDS
9 3 (1.58%) Data Warehouse
9 3 (1.58%) Metadata
9 3 (1.58%) MySQL
9 3 (1.58%) RDBMS
10 2 (1.05%) Apache Cassandra
10 2 (1.05%) Data Vault
10 2 (1.05%) Geospatial Data
10 2 (1.05%) Hadoop
10 2 (1.05%) Redis
11 1 (0.53%) MariaDB
11 1 (0.53%) RavenDB
Development Applications
1 38 (20.00%) Git
2 21 (11.05%) GitLab
3 19 (10.00%) Jenkins
4 15 (7.89%) SonarQube
5 5 (2.63%) MSBuild
5 5 (2.63%) Octopus Deploy
5 5 (2.63%) Team Foundation Server
5 5 (2.63%) Visual Studio
6 3 (1.58%) Cucumber
7 2 (1.05%) Cypress.io
7 2 (1.05%) Jasmine
7 2 (1.05%) JUnit
7 2 (1.05%) Selenium
8 1 (0.53%) Crashlytics
8 1 (0.53%) fastlane
8 1 (0.53%) Gradle
8 1 (0.53%) Karma Test Runner
8 1 (0.53%) NUnit
8 1 (0.53%) Postman
8 1 (0.53%) Storybook
General
1 49 (25.79%) Finance
2 38 (20.00%) Social Skills
3 33 (17.37%) Marketing
4 30 (15.79%) Inclusion and Diversity
5 16 (8.42%) Games
5 16 (8.42%) Retail
6 15 (7.89%) Presentation Skills
7 10 (5.26%) Analytical Skills
7 10 (5.26%) Banking
8 8 (4.21%) Law
9 5 (2.63%) Public Sector
10 4 (2.11%) Front Office
10 4 (2.11%) General Ledger
11 3 (1.58%) Legal
12 2 (1.05%) Back Office
12 2 (1.05%) Telecoms
13 1 (0.53%) Publishing
13 1 (0.53%) Retail Banking
Job Titles
1 83 (43.68%) Developer
2 40 (21.05%) Lead
3 35 (18.42%) Senior
4 31 (16.32%) Architect
5 29 (15.26%) Lead Developer
6 27 (14.21%) .NET Developer
7 16 (8.42%) C# Developer
8 15 (7.89%) Consultant
8 15 (7.89%) Senior Developer
9 14 (7.37%) Salesforce Architect
9 14 (7.37%) Software Engineer
10 13 (6.84%) Dynamics 365 Consultant
10 13 (6.84%) Functional Consultant
10 13 (6.84%) Technical Architect
11 12 (6.32%) Software Developer
12 11 (5.79%) Azure Developer
12 11 (5.79%) Lead .NET Developer
13 10 (5.26%) Python Developer
13 10 (5.26%) SaaS Developer
14 9 (4.74%) Lead C# Developer
Libraries, Frameworks & Software Standards
1 68 (35.79%) .NET
2 40 (21.05%) React
3 34 (17.89%) REST
4 22 (11.58%) .NET Framework
5 21 (11.05%) CSS
5 21 (11.05%) HTML
6 17 (8.95%) SOAP
7 16 (8.42%) ASP.NET Web API
7 16 (8.42%) RESTful
8 15 (7.89%) Lightning Web Components
8 15 (7.89%) Visualforce
9 14 (7.37%) Entity Framework
10 13 (6.84%) .NET Core
11 12 (6.32%) ASP.NET
12 11 (5.79%) ASP.NET Web Forms
12 11 (5.79%) Flask
12 11 (5.79%) Kafka
12 11 (5.79%) Razor View Engine
13 10 (5.26%) Core Data
13 10 (5.26%) UIKit
Miscellaneous
1 38 (20.00%) Product Ownership
2 18 (9.47%) Distributed Systems
3 17 (8.95%) Data Structures
4 16 (8.42%) Cloud Native
5 13 (6.84%) Management Information System
6 12 (6.32%) Mobile App
7 7 (3.68%) Algorithms
7 7 (3.68%) Blockchain
7 7 (3.68%) Hedge funds
7 7 (3.68%) Web3
8 5 (2.63%) Legacy Systems
8 5 (2.63%) PKI
9 4 (2.11%) BYOD
9 4 (2.11%) Data Protection Act
9 4 (2.11%) Self-Motivation
10 3 (1.58%) e-Learning
10 3 (1.58%) Video Conferencing
11 2 (1.05%) Client/Server
11 2 (1.05%) Foreign Exchange (FX)
11 2 (1.05%) iPhone
Operating Systems
1 20 (10.53%) Apple iOS
2 16 (8.42%) Android
3 11 (5.79%) Windows
4 1 (0.53%) Linux
Processes & Methodologies
1 123 (64.74%) Agile
2 84 (44.21%) DevOps
3 82 (43.16%) Mentoring
4 70 (36.84%) CI/CD
5 63 (33.16%) Microservices
6 59 (31.05%) Continuous Improvement
7 50 (26.32%) Architectural Patterns
8 49 (25.79%) Computer Science
8 49 (25.79%) Software Engineering
9 45 (23.68%) Scrum
10 42 (22.11%) Problem-Solving
11 40 (21.05%) Code Quality
12 37 (19.47%) Continuous Integration
13 36 (18.95%) Technical Leadership
14 32 (16.84%) AI
15 29 (15.26%) Full-Stack Development
16 27 (14.21%) OO
17 26 (13.68%) Front End Development
17 26 (13.68%) Roadmaps
18 25 (13.16%) Coaching
Programming Languages
1 52 (27.37%) C#
2 47 (24.74%) SQL
3 34 (17.89%) JavaScript
4 31 (16.32%) Python
5 30 (15.79%) TypeScript
6 21 (11.05%) Java
7 15 (7.89%) Apex Code
7 15 (7.89%) SOQL
7 15 (7.89%) SOSL
7 15 (7.89%) Swift
8 11 (5.79%) Kotlin
9 7 (3.68%) Go
9 7 (3.68%) Rust
10 5 (2.63%) Scala
11 4 (2.11%) C++
12 3 (1.58%) Embedded C
13 2 (1.05%) Delphi
13 2 (1.05%) PHP
13 2 (1.05%) R
14 1 (0.53%) T-SQL
Qualifications
1 51 (26.84%) Degree
2 41 (21.58%) Computer Science Degree
3 15 (7.89%) Master's Degree
4 7 (3.68%) Security Cleared
5 6 (3.16%) SC Cleared
6 2 (1.05%) PhD
7 1 (0.53%) AWS Certification
7 1 (0.53%) AWS Certified Solutions Architect
7 1 (0.53%) Azure Certification
7 1 (0.53%) CISM
7 1 (0.53%) CISSP
7 1 (0.53%) CompTIA Security+
7 1 (0.53%) DV Cleared
Quality Assurance & Compliance
1 31 (16.32%) QA
2 10 (5.26%) GDPR
3 7 (3.68%) Accessibility
4 4 (2.11%) Data Quality
5 1 (0.53%) COBIT
5 1 (0.53%) IFRS
5 1 (0.53%) NIST
System Software
1 30 (15.79%) Docker
2 12 (6.32%) Active Directory
3 3 (1.58%) Firmware
4 2 (1.05%) Embedded Firmware
Systems Management
1 13 (6.84%) Kubernetes
2 12 (6.32%) Terraform
3 2 (1.05%) Ansible
3 2 (1.05%) Grafana
3 2 (1.05%) Progress Chef
3 2 (1.05%) Puppet
4 1 (0.53%) Computer Emergency Response Teams
4 1 (0.53%) Kibana
Vendors
1 37 (19.47%) Microsoft
2 19 (10.00%) Splunk
3 16 (8.42%) Salesforce
4 7 (3.68%) Syncfusion
4 7 (3.68%) Telerik
5 4 (2.11%) Databricks
5 4 (2.11%) Trayport
6 3 (1.58%) Google
7 2 (1.05%) Adobe
7 2 (1.05%) Oracle
8 1 (0.53%) Thales
8 1 (0.53%) Xamarin