Hybrid/Remote DV Cleared Job Trends

Developed Vetting (DV) Clearance
UK > Work from Home

The table below provides summary statistics for remote or hybrid work with a requirement for DV Cleared qualifications. It includes a benchmarking guide to the salaries offered over the 6 months leading up to 20 November 2025, comparing them to the same period in the previous two years.

6 months to
20 Nov 2025
Same period 2024 Same period 2023
Rank 159 181 162
Rank change year-on-year +22 -19 +286
Permanent jobs citing DV Cleared 248 341 466
As % of all permanent jobs with remote/hybrid work options 1.62% 1.74% 2.19%
As % of the Qualifications category 4.59% 6.61% 7.78%
Number of salaries quoted 143 158 236
10th Percentile £45,608 £44,106 £42,500
25th Percentile £56,250 £56,250 £47,500
Median annual salary (50th Percentile) £70,000 £77,500 £55,000
Median % change year-on-year -9.68% +40.91% -17.91%
75th Percentile £80,000 £85,000 £72,000
90th Percentile £89,750 £93,750 £80,000
UK median annual salary £70,000 £60,000 £55,000
% change year-on-year +16.67% +9.09% -4.35%

All Academic and Professional Certifications
Work from Home

DV Cleared falls under the Academic Qualifications and Professional Certifications category. For comparison with the information above, the following table provides summary statistics for all permanent job vacancies with remote or hybrid options requiring academic qualifications or professional certifications.

Permanent vacancies requiring academic qualifications or professional certifications 5,404 5,157 5,989
As % of all permanent jobs with a WFH option 35.33% 26.25% 28.13%
Number of salaries quoted 2,468 2,538 4,406
10th Percentile £29,750 £35,000 £35,226
25th Percentile £41,250 £46,250 £45,250
Median annual salary (50th Percentile) £60,000 £60,000 £60,000
75th Percentile £78,312 £76,250 £76,250
90th Percentile £93,750 £87,500 £92,500
UK median annual salary £55,000 £58,500 £57,500
% change year-on-year -5.98% +1.74% +1.64%

DV Cleared
Job Vacancy Trend for Remote/Hybrid Jobs

Historical trend showing the proportion of permanent IT job postings citing DV Cleared and offering remote or hybrid work options relative to all permanent IT jobs advertised.
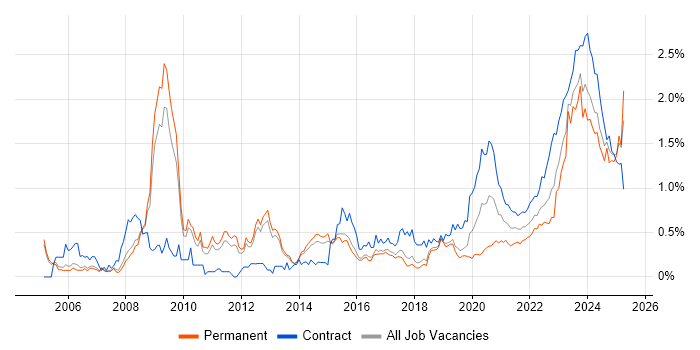
DV Cleared job vacancy trend for remote/hybrid jobs

DV Cleared
Salary Trend for Remote/Hybrid Jobs

Salary distribution trend for jobs with remote/hybrid work options citing DV Cleared.

Salary distribution trend for jobs with remote/hybrid work options citing DV Cleared

DV Cleared
Salary Histogram for Remote/Hybrid Jobs

Salary distribution for jobs with remote/hybrid work options citing DV Cleared over the 6 months to 20 November 2025.

DV Cleared salary histogram for jobs with remote/hybrid work options

DV Cleared
Co-Occurring Skills & Capabilities in Remote/Hybrid Jobs by Category

The following tables expand on the one above by listing co-occurrences grouped by category. They cover the same employment type, locality and period, with up to 20 co-occurrences shown in each category:

Application Platforms
1 3 (1.21%) SharePoint
1 3 (1.21%) Tomcat
1 3 (1.21%) WebLogic
1 3 (1.21%) WebLogic Portal
2 1 (0.40%) Apache
Applications
1 5 (2.02%) Microsoft Excel
2 2 (0.81%) Microsoft PowerPoint
2 2 (0.81%) MS Visio
Business Applications
1 3 (1.21%) Oracle EBS
1 3 (1.21%) Primavera
Cloud Services
1 38 (15.32%) Azure
2 32 (12.90%) AWS
3 13 (5.24%) GCP
4 11 (4.44%) OCI
5 8 (3.23%) Azure Stack
5 8 (3.23%) Entra ID
5 8 (3.23%) SaaS
6 7 (2.82%) IaaS
6 7 (2.82%) PaaS
7 6 (2.42%) AWS CloudFormation
7 6 (2.42%) OpenShift
7 6 (2.42%) Power Platform
8 3 (1.21%) Azure DevOps
8 3 (1.21%) GitHub
8 3 (1.21%) Microsoft 365
8 3 (1.21%) PowerApps
8 3 (1.21%) Serverless
9 2 (0.81%) GitHub Actions
10 1 (0.40%) AWS KMS
10 1 (0.40%) AWS Lambda
Communications & Networking
1 12 (4.84%) VPN
2 11 (4.44%) LAN
3 10 (4.03%) Firewall
4 9 (3.63%) Junos
5 8 (3.23%) Wi-Fi
6 7 (2.82%) WAN
7 5 (2.02%) MPLS
7 5 (2.02%) Network Security
8 4 (1.61%) BGP
8 4 (1.61%) Cisco IOS
8 4 (1.61%) DMZ
8 4 (1.61%) Ethernet
8 4 (1.61%) IPsec
8 4 (1.61%) Wireshark
9 2 (0.81%) S/MIME
9 2 (0.81%) SSL
9 2 (0.81%) TCP/IP
9 2 (0.81%) VoIP
9 2 (0.81%) X.509
10 1 (0.40%) ICMP
Database & Business Intelligence
1 6 (2.42%) Power BI
2 4 (1.61%) NoSQL
3 3 (1.21%) Oracle Database
3 3 (1.21%) Oracle Discoverer
3 3 (1.21%) Oracle Reports
3 3 (1.21%) Qlik Sense
3 3 (1.21%) Tableau
4 2 (0.81%) Amazon RDS
4 2 (0.81%) InfluxDB
4 2 (0.81%) MongoDB
4 2 (0.81%) MySQL
4 2 (0.81%) Relational Database
5 1 (0.40%) Amazon Aurora
5 1 (0.40%) DB2
5 1 (0.40%) Elasticsearch
5 1 (0.40%) Geospatial Data
5 1 (0.40%) GIS
5 1 (0.40%) Metadata
5 1 (0.40%) PostgreSQL
Development Applications
1 11 (4.44%) Jenkins
2 6 (2.42%) GitLab
3 4 (1.61%) Robot Framework
4 3 (1.21%) Git
4 3 (1.21%) JMeter
4 3 (1.21%) Oracle APEX
4 3 (1.21%) Oracle Forms
4 3 (1.21%) Selenium
5 2 (0.81%) Bitbucket
5 2 (0.81%) Eclipse
5 2 (0.81%) IDA Disassembler
5 2 (0.81%) SonarQube
5 2 (0.81%) TestRail
6 1 (0.40%) Atlassian Bamboo
6 1 (0.40%) Gatling
6 1 (0.40%) LoadRunner
6 1 (0.40%) Subversion
General
1 82 (33.06%) Finance
2 50 (20.16%) Analytical Skills
2 50 (20.16%) Social Skills
3 39 (15.73%) Public Sector
4 31 (12.50%) Electronics
5 22 (8.87%) Telecoms
6 14 (5.65%) Manufacturing
6 14 (5.65%) Presentation Skills
7 13 (5.24%) Marketing
8 5 (2.02%) Military
9 3 (1.21%) Inclusion and Diversity
9 3 (1.21%) Legal
9 3 (1.21%) Organisational Skills
10 2 (0.81%) Advertising
11 1 (0.40%) Aerospace
11 1 (0.40%) Games
11 1 (0.40%) Influencing Skills
11 1 (0.40%) Law
11 1 (0.40%) Publishing
Job Titles
1 44 (17.74%) Administrator
1 44 (17.74%) Infrastructure Engineer
2 41 (16.53%) Systems Administrator
3 37 (14.92%) Senior
4 33 (13.31%) Systems Engineer
5 30 (12.10%) Architect
6 18 (7.26%) Analyst
7 10 (4.03%) Cloud Architect
7 10 (4.03%) Consultant
7 10 (4.03%) Security Architect
8 9 (3.63%) Electronics Engineer
8 9 (3.63%) Senior Electronics Engineer
9 8 (3.23%) IT Engineer
9 8 (3.23%) IT Infrastructure Engineer
9 8 (3.23%) Lead
10 7 (2.82%) Network Engineer
11 6 (2.42%) Business Analyst
11 6 (2.42%) DevOps Engineer
11 6 (2.42%) Senior Systems Engineer
12 5 (2.02%) Trainer
Libraries, Frameworks & Software Standards
1 35 (14.11%) OLE
2 5 (2.02%) Elastic Stack
3 3 (1.21%) EDI
3 3 (1.21%) ModSecurity
3 3 (1.21%) Oracle ADF
3 3 (1.21%) WebCenter
4 2 (0.81%) EJB
5 1 (0.40%) Flash
5 1 (0.40%) JSON
5 1 (0.40%) Node.js
5 1 (0.40%) Pandas
5 1 (0.40%) React
5 1 (0.40%) Spring
5 1 (0.40%) Spring Boot
5 1 (0.40%) Web Services
5 1 (0.40%) XML
Miscellaneous
1 64 (25.81%) e-Learning
2 11 (4.44%) Data Centre
3 9 (3.63%) Cloud Native
3 9 (3.63%) FPGA
3 9 (3.63%) Self-Motivation
4 8 (3.23%) Hybrid Cloud
4 8 (3.23%) Onboarding
4 8 (3.23%) Private Cloud
5 7 (2.82%) Analytical Mindset
6 6 (2.42%) PKI
6 6 (2.42%) Product Ownership
7 5 (2.02%) Cyber Kill Chain
7 5 (2.02%) Public Cloud
7 5 (2.02%) Security Posture
8 4 (1.61%) Cloud Security Posture
8 4 (1.61%) Cyber Defence
8 4 (1.61%) Linux Command Line
9 3 (1.21%) Blog
9 3 (1.21%) Cyber Threat
9 3 (1.21%) Driving Licence
Operating Systems
1 71 (28.63%) Linux
2 28 (11.29%) Unix
3 26 (10.48%) Windows
4 13 (5.24%) Windows Server
5 8 (3.23%) Rocky
5 8 (3.23%) Windows Server 2019
6 3 (1.21%) CentOS
7 1 (0.40%) Red Hat Enterprise Linux
7 1 (0.40%) Ubuntu
7 1 (0.40%) Windows Server 2016
Processes & Methodologies
1 64 (25.81%) Innovative Thinking
2 58 (23.39%) Problem-Solving
3 48 (19.35%) Infrastructure Engineering
4 46 (18.55%) Agile
5 42 (16.94%) High Availability
6 25 (10.08%) Mathematics
7 24 (9.68%) Cybersecurity
7 24 (9.68%) Physics
7 24 (9.68%) Trend Analysis
8 19 (7.66%) Containerisation
9 18 (7.26%) CI/CD
10 16 (6.45%) Infrastructure as Code
11 15 (6.05%) Business Intelligence
11 15 (6.05%) DevOps
12 14 (5.65%) Requirements Gathering
13 13 (5.24%) Digital Marketing
13 13 (5.24%) Programme Management
14 12 (4.84%) Continuous Improvement
14 12 (4.84%) Software Engineering
14 12 (4.84%) Stakeholder Engagement
Programming Languages
1 22 (8.87%) Python
2 10 (4.03%) Bash
2 10 (4.03%) SQL
3 8 (3.23%) PowerShell
4 6 (2.42%) C
4 6 (2.42%) C++
5 4 (1.61%) Java
5 4 (1.61%) JavaScript
6 3 (1.21%) Bicep
6 3 (1.21%) Go
6 3 (1.21%) PL/SQL
6 3 (1.21%) VBA
7 1 (0.40%) PL/1
7 1 (0.40%) TypeScript
Qualifications
1 248 (100.00%) Security Cleared
2 139 (56.05%) SC Cleared
3 54 (21.77%) Degree
4 52 (20.97%) Cisco Certification
5 50 (20.16%) CCNP
6 36 (14.52%) CCNA
7 14 (5.65%) Azure Certification
7 14 (5.65%) RHCSA
8 8 (3.23%) BPSS Clearance
8 8 (3.23%) CISM
8 8 (3.23%) CISSP
8 8 (3.23%) Network+ Certification
8 8 (3.23%) NVQ Level 3
9 5 (2.02%) City & Guilds
10 4 (1.61%) Computer Science Degree
10 4 (1.61%) JNCIA
10 4 (1.61%) JNCIS
11 3 (1.21%) CITP
11 3 (1.21%) Master's Degree
12 2 (0.81%) CompTIA Security+
Quality Assurance & Compliance
1 14 (5.65%) ISO/IEC 27001
2 13 (5.24%) NIST
3 7 (2.82%) GDPR
3 7 (2.82%) GRC
3 7 (2.82%) JSP 440
3 7 (2.82%) NCSC
3 7 (2.82%) QA
4 5 (2.02%) ISO/IEC 42001
5 4 (1.61%) PCI DSS
6 3 (1.21%) Accessibility
6 3 (1.21%) ISO 14001
6 3 (1.21%) ISO 9001
6 3 (1.21%) NEBOSH
7 1 (0.40%) Data Quality
7 1 (0.40%) ISO/IEC 27005
System Software
1 15 (6.05%) Docker
2 14 (5.65%) Active Directory
3 9 (3.63%) Firmware
4 8 (3.23%) Hyper-V
5 4 (1.61%) Virtual Machines
6 1 (0.40%) VMware ESXi
6 1 (0.40%) VMware Infrastructure
6 1 (0.40%) VMware NSX
6 1 (0.40%) vSphere
Systems Management
1 24 (9.68%) Kubernetes
2 14 (5.65%) Terraform
3 11 (4.44%) Ansible
4 5 (2.02%) Grafana
5 4 (1.61%) Prometheus
6 3 (1.21%) Oracle Enterprise Manager
7 2 (0.81%) Computer Emergency Response Teams
7 2 (0.81%) Docker Swarm
7 2 (0.81%) Endace
7 2 (0.81%) Nessus
7 2 (0.81%) WSUS
7 2 (0.81%) ZABBIX
8 1 (0.40%) Active Directory Federation Services
8 1 (0.40%) Argo
8 1 (0.40%) Kibana
8 1 (0.40%) OpenView
8 1 (0.40%) Puppet
8 1 (0.40%) Rancher
8 1 (0.40%) Tivoli
8 1 (0.40%) vCenter Server
Vendors
1 54 (21.77%) Cisco
2 17 (6.85%) Red Hat
3 13 (5.24%) Juniper
3 13 (5.24%) SAP
4 10 (4.03%) Microsoft
5 8 (3.23%) Dell
6 7 (2.82%) Splunk
7 6 (2.42%) Oracle
8 5 (2.02%) VMware
9 3 (1.21%) IFS
10 2 (0.81%) Atlassian
10 2 (0.81%) Google
10 2 (0.81%) Thales
11 1 (0.40%) Citrix
11 1 (0.40%) Commvault
11 1 (0.40%) EMC
11 1 (0.40%) Fortinet
11 1 (0.40%) HP
11 1 (0.40%) Riverbed
11 1 (0.40%) Siebel