Technical Architect
UK > Work from Home
The median Technical Architect salary for remote or hybrid work is £82,500 per year, according to job vacancies posted during the 6 months leading to 1 May 2025.
The table below provides salary benchmarking and summary statistics, comparing them to the same period in the previous two years.
| 6 months to 1 May 2025 |
Same period 2024 | Same period 2023 | |
|---|---|---|---|
| Rank | 336 | 411 | 346 |
| Rank change year-on-year | +75 | -65 | +186 |
| Permanent jobs requiring a Technical Architect | 61 | 186 | 373 |
| As % of all permanent jobs with a WFH option | 0.41% | 0.55% | 0.87% |
| As % of the Job Titles category | 0.45% | 0.57% | 0.91% |
| Number of salaries quoted | 56 | 143 | 182 |
| 10th Percentile | £71,250 | £54,201 | £57,625 |
| 25th Percentile | £81,250 | £63,125 | £70,000 |
| Median annual salary (50th Percentile) | £82,500 | £70,000 | £78,000 |
| Median % change year-on-year | +17.86% | -10.26% | -2.50% |
| 75th Percentile | £92,500 | £86,250 | £92,188 |
| 90th Percentile | £104,000 | £92,500 | £102,375 |
| UK median annual salary | £82,500 | £77,500 | £85,000 |
| % change year-on-year | +6.45% | -8.82% | +6.25% |
All Permanent IT Job Vacancies
Work from Home
For comparison with the information above, the following table provides summary statistics for all permanent IT job vacancies with WFH or hybrid options. Most job vacancies include a discernible job title that can be normalized. As such, the figures in the second row provide an indication of the number of permanent jobs in our overall sample.
| Permanent vacancies in Work from Home with a recognized job title | 13,554 | 32,482 | 41,080 |
| % of permanent jobs with a recognized job title | 90.64% | 95.99% | 96.08% |
| Number of salaries quoted | 9,860 | 24,960 | 29,208 |
| 10th Percentile | £30,000 | £33,000 | £36,500 |
| 25th Percentile | £43,750 | £42,500 | £47,250 |
| Median annual salary (50th Percentile) | £60,000 | £56,000 | £62,500 |
| Median % change year-on-year | +7.14% | -10.40% | +4.17% |
| 75th Percentile | £77,500 | £75,000 | £81,250 |
| 90th Percentile | £100,000 | £92,500 | £100,000 |
| UK median annual salary | £57,500 | £52,777 | £60,000 |
| % change year-on-year | +8.95% | -12.04% | - |
Technical Architect
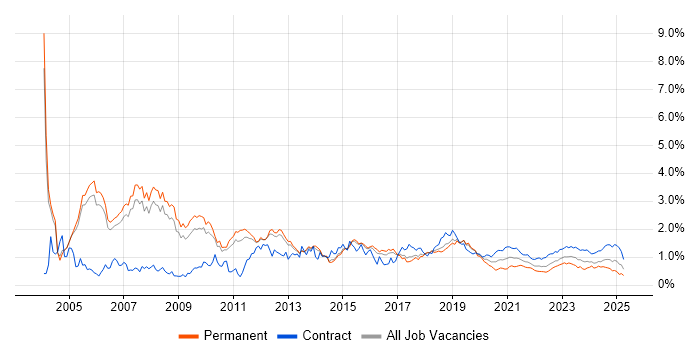
Trend for Jobs with a WFH Option
Job vacancies with remote working options which featured Technical Architect in the job title as a proportion of all IT jobs advertised.

Technical Architect
Salary Trend for Jobs with a WFH Option
3-month moving average salary quoted in job vacancies with remote working options citing Technical Architect.
Technical Architect
Salary Histogram for Jobs with a WFH Option
Salary distribution for jobs with remote working options citing Technical Architect over the 6 months to 1 May 2025.
Technical Architect Skill Set
Top 30 Co-occurring Skills and Capabilities in Job Vacancies with WFH Options
For the 6 months to 1 May 2025, Technical Architect job roles required the following skills and capabilities in order of popularity. The figures indicate the absolute number co-occurrences and as a proportion of all permanent jobs with hybrid or remote work options featuring Technical Architect in the job title.
|
|
Technical Architect Skill Set
Co-occurring Skills and Capabilities with WFH Options by Category
The follow tables expand on the table above by listing co-occurrences grouped by category. The same employment type, locality and period is covered with up to 20 co-occurrences shown in each of the following categories:
|
|
|||||||||||||||||||||||||||||||||||||||||||||||||||||||||||||||||||||||||||||||||||||||||||||||||||||||||||||||||||||
|
|
|||||||||||||||||||||||||||||||||||||||||||||||||||||||||||||||||||||||||||||||||||||||||||||||||||||||||||||||||||||
|
|
|||||||||||||||||||||||||||||||||||||||||||||||||||||||||||||||||||||||||||||||||||||||||||||||||||||||||||||||||||||
|
|
|||||||||||||||||||||||||||||||||||||||||||||||||||||||||||||||||||||||||||||||||||||||||||||||||||||||||||||||||||||
|
|
|||||||||||||||||||||||||||||||||||||||||||||||||||||||||||||||||||||||||||||||||||||||||||||||||||||||||||||||||||||
|
|
|||||||||||||||||||||||||||||||||||||||||||||||||||||||||||||||||||||||||||||||||||||||||||||||||||||||||||||||||||||
|
|
|||||||||||||||||||||||||||||||||||||||||||||||||||||||||||||||||||||||||||||||||||||||||||||||||||||||||||||||||||||
|
|
|||||||||||||||||||||||||||||||||||||||||||||||||||||||||||||||||||||||||||||||||||||||||||||||||||||||||||||||||||||
|
||||||||||||||||||||||||||||||||||||||||||||||||||||||||||||||||||||||||||||||||||||||||||||||||||||||||||||||||||||||
