OLTP Jobs in England

Online Transaction Processing (OLTP)
UK > England

The following table provides summary statistics for permanent job vacancies advertised in England with a requirement for OLTP skills. Included is a benchmarking guide to the salaries offered in vacancies that have cited OLTP over the 6 months to 28 April 2024 with a comparison to the same period in the previous 2 years.

6 months to
28 Apr 2024
Same period 2023 Same period 2022
Rank 775 821 943
Rank change year-on-year +46 +122 -181
Permanent jobs citing OLTP 40 106 199
As % of all permanent jobs advertised in England 0.047% 0.11% 0.15%
As % of the Database & Business Intelligence category 0.27% 0.53% 0.55%
Number of salaries quoted 30 72 148
10th Percentile £42,125 £45,000 £42,500
25th Percentile £44,063 £48,750 £48,750
Median annual salary (50th Percentile) £67,500 £65,000 £62,250
Median % change year-on-year +3.85% +4.42% +13.18%
75th Percentile £71,250 £85,313 £83,750
90th Percentile - £100,000 £95,000
UK median annual salary £67,500 £65,000 £62,500
% change year-on-year +3.85% +4.00% +13.64%

All Database and Business Intelligence Skills
England

OLTP is in the Databases and Business Intelligence category. The following table is for comparison with the above and provides summary statistics for all permanent job vacancies advertised in England with a requirement for database or business intelligence skills.

Permanent vacancies with a requirement for database or business intelligence skills 15,092 20,071 35,914
As % of all permanent jobs advertised in England 17.78% 21.67% 27.44%
Number of salaries quoted 11,403 12,558 19,280
10th Percentile £35,000 £37,500 £36,250
25th Percentile £43,000 £47,500 £45,000
Median annual salary (50th Percentile) £57,500 £65,000 £60,000
Median % change year-on-year -11.54% +8.33% +9.09%
75th Percentile £77,500 £85,000 £80,000
90th Percentile £96,250 £105,000 £95,000
UK median annual salary £57,500 £65,000 £60,000
% change year-on-year -11.54% +8.33% +9.09%

OLTP
Job Vacancy Trend in England

Job postings citing OLTP as a proportion of all IT jobs advertised in England.
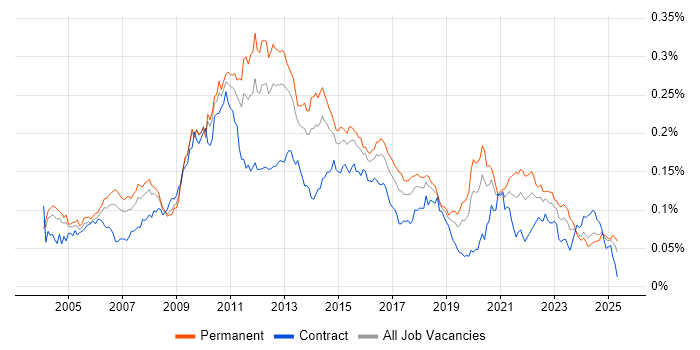
Job vacancy trend for OLTP in England

OLTP
Salary Trend in England

3-month moving average salary quoted in jobs citing OLTP in England.

Salary trend for OLTP in England

OLTP
Salary Histogram in England

Salary distribution for jobs citing OLTP in England over the 6 months to 28 April 2024.

Salary histogram for OLTP in England

OLTP
Job Locations in England

The table below looks at the demand and provides a guide to the median salaries quoted in IT jobs citing OLTP within the England region over the 6 months to 28 April 2024. The 'Rank Change' column provides an indication of the change in demand within each location based on the same 6 month period last year.

Location Rank Change
on Same Period
Last Year
Matching
Permanent
IT Job Ads
Median Salary
Past 6 Months
Median Salary
% Change
on Same Period
Last Year
Live
Jobs
South East +14 15 £67,500 - 3
North of England +31 8 £50,000 -4.76% 7
North West +19 8 £50,000 - 3
South West -28 7 £43,500 - 2
London +97 5 £37,500 -42.31% 5
East of England +9 2 £70,000 -17.65% 1
West Midlands +26 1 £70,000 +27.27% 1
Midlands -1 1 £70,000 +27.27% 3
OLTP
UK

OLTP
Co-occurring Skills and Capabilities in England by Category

The follow tables expand on the table above by listing co-occurrences grouped by category. The same employment type, locality and period is covered with up to 20 co-occurrences shown in each of the following categories:

Application Platforms
1 3 (7.50%) Tomcat
1 3 (7.50%) WildFly
2 1 (2.50%) Apache Airflow
2 1 (2.50%) Jupyter
Business Applications
1 1 (2.50%) Unit4 Business World
Cloud Services
1 6 (15.00%) Azure
2 4 (10.00%) AWS
3 3 (7.50%) Power Platform
4 2 (5.00%) Azure DevOps
4 2 (5.00%) CloudBees
4 2 (5.00%) OCI
5 1 (2.50%) Amazon S3
5 1 (2.50%) Azure API Management
5 1 (2.50%) Azure Batch
5 1 (2.50%) Azure Data Factory
5 1 (2.50%) Azure Functions
5 1 (2.50%) Azure Key Vault
5 1 (2.50%) Azure Logic Apps
5 1 (2.50%) Azure Service Bus
5 1 (2.50%) Azure Storage
5 1 (2.50%) Power Automate
5 1 (2.50%) PowerApps
5 1 (2.50%) Serverless
Database & Business Intelligence
1 17 (42.50%) SQL Server
2 11 (27.50%) Relational Database
3 10 (25.00%) Data Warehouse
3 10 (25.00%) MySQL
4 8 (20.00%) SQL Server Integration Services
5 4 (10.00%) PostgreSQL
5 4 (10.00%) SQL Server Reporting Services
6 3 (7.50%) MariaDB
6 3 (7.50%) OLAP
6 3 (7.50%) RDBMS
7 2 (5.00%) MongoDB
7 2 (5.00%) Power BI
7 2 (5.00%) Tableau
8 1 (2.50%) Amazon Redshift
8 1 (2.50%) Azure SQL Database
8 1 (2.50%) Big Data
8 1 (2.50%) Data Lake
8 1 (2.50%) Metadata
8 1 (2.50%) NoSQL
Development Applications
1 10 (25.00%) Git
2 6 (15.00%) JIRA
3 4 (10.00%) Jenkins
4 1 (2.50%) Bitbucket
4 1 (2.50%) GitLab
4 1 (2.50%) Visual Studio Team System
General
1 9 (22.50%) Social Skills
2 7 (17.50%) Analytical Skills
3 6 (15.00%) Games
4 3 (7.50%) Finance
5 2 (5.00%) Law
5 2 (5.00%) Legal
5 2 (5.00%) Military
6 1 (2.50%) Retail
Job Titles
1 24 (60.00%) Developer
2 16 (40.00%) SQL Developer
3 15 (37.50%) Senior
3 15 (37.50%) Senior Developer
4 14 (35.00%) Oracle Developer
5 13 (32.50%) Senior Oracle Developer
6 11 (27.50%) DBA
7 9 (22.50%) Senior SQL Developer
8 8 (20.00%) PL/SQL Developer
9 7 (17.50%) Administrator
9 7 (17.50%) Senior PL/SQL Developer
10 4 (10.00%) SQL Server Developer
11 3 (7.50%) MySQL DBA
12 2 (5.00%) Environment Manager
12 2 (5.00%) Mainframe Systems Engineer
12 2 (5.00%) Oracle DBA
12 2 (5.00%) QA Engineer
12 2 (5.00%) Senior SQL Server Developer
12 2 (5.00%) SQL DBA
12 2 (5.00%) Systems Engineer
Libraries, Frameworks & Software Standards
1 14 (35.00%) XML
2 13 (32.50%) HTML
2 13 (32.50%) SOAP
3 3 (7.50%) .NET
4 1 (2.50%) ARM Templates
4 1 (2.50%) JSON
4 1 (2.50%) Web Services
Miscellaneous
1 7 (17.50%) Learning Management System
2 4 (10.00%) Self-Motivation
3 2 (5.00%) Data Centre
3 2 (5.00%) Mainframe
3 2 (5.00%) Replication
3 2 (5.00%) Virtual Team
4 1 (2.50%) Public Cloud
Operating Systems
1 7 (17.50%) Linux
2 2 (5.00%) Windows
Processes & Methodologies
1 20 (50.00%) Problem-Solving
2 13 (32.50%) Software Testing
3 11 (27.50%) Data Modelling
4 8 (20.00%) Agile
5 7 (17.50%) Security Patching
6 6 (15.00%) Business Intelligence
7 5 (12.50%) Computer Science
8 4 (10.00%) CI/CD
8 4 (10.00%) Continuous Improvement
8 4 (10.00%) Continuous Integration
8 4 (10.00%) Performance Monitoring
8 4 (10.00%) Performance Tuning
8 4 (10.00%) Release Management
9 3 (7.50%) Collaborative Culture
9 3 (7.50%) Continuous Delivery
9 3 (7.50%) High Availability
9 3 (7.50%) Performance Optimisation
9 3 (7.50%) Scrum
9 3 (7.50%) Server Management
9 3 (7.50%) Test Automation
Programming Languages
1 33 (82.50%) SQL
2 14 (35.00%) PL/SQL
3 10 (25.00%) T-SQL
4 3 (7.50%) Java
5 2 (5.00%) COBOL
5 2 (5.00%) HLASM
5 2 (5.00%) PHP
5 2 (5.00%) Python
5 2 (5.00%) REXX
5 2 (5.00%) Shell Script
6 1 (2.50%) C#
6 1 (2.50%) PowerShell
Qualifications
1 9 (22.50%) Degree
2 5 (12.50%) Computer Science Degree
3 2 (5.00%) ISTQB
3 2 (5.00%) SC Cleared
3 2 (5.00%) Security Cleared
Quality Assurance & Compliance
1 8 (20.00%) QA
System Software
1 2 (5.00%) Docker
Systems Management
1 2 (5.00%) Ansible
1 2 (5.00%) Kubernetes
2 1 (2.50%) Terraform
Vendors
1 21 (52.50%) Oracle
2 1 (2.50%) Databricks
2 1 (2.50%) Informatica
2 1 (2.50%) Microsoft