JSON Job Trends in England

JSON
UK > England

The table below provides summary statistics and salary benchmarking for jobs advertised in England requiring JSON skills. It covers permanent job vacancies from the 6 months leading up to 2 November 2025, with comparisons to the same periods in the previous two years.

6 months to
2 Nov 2025
Same period 2024 Same period 2023
Rank 384 318 212
Rank change year-on-year -66 -106 +12
Permanent jobs citing JSON 274 503 781
As % of all permanent jobs in England 0.63% 0.83% 1.62%
As % of the Libraries, Frameworks & Software Standards category 4.01% 4.04% 5.95%
Number of salaries quoted 216 314 657
10th Percentile £41,250 £36,250 £43,750
25th Percentile £50,000 £42,500 £52,500
Median annual salary (50th Percentile) £58,750 £60,000 £65,000
Median % change year-on-year -2.08% -7.69% -5.55%
75th Percentile £75,000 £79,375 £85,000
90th Percentile £83,750 £86,750 £98,000
UK median annual salary £62,500 £57,500 £65,000
% change year-on-year +8.70% -11.54% -3.70%

All Software Libraries and Frameworks
England

JSON falls under the Software Libraries and Frameworks category. For comparison with the information above, the following table provides summary statistics for all permanent job vacancies requiring technical specification, industry standards, software libraries and framework skills in England.

Permanent vacancies with a requirement for technical specification, industry standards, software libraries and framework skills 6,841 12,464 13,128
As % of all permanent jobs advertised in England 15.70% 20.45% 27.22%
Number of salaries quoted 4,565 7,499 10,735
10th Percentile £36,750 £40,000 £41,250
25th Percentile £50,000 £49,553 £51,250
Median annual salary (50th Percentile) £67,500 £65,000 £67,500
Median % change year-on-year +3.85% -3.70% +3.85%
75th Percentile £87,500 £85,000 £86,250
90th Percentile £115,000 £112,300 £107,500
UK median annual salary £67,500 £65,000 £65,351
% change year-on-year +3.85% -0.54% +0.54%

JSON
Job Vacancy Trend in England

Historical trend showing the proportion of permanent IT job postings citing JSON relative to all permanent IT jobs advertised in England.
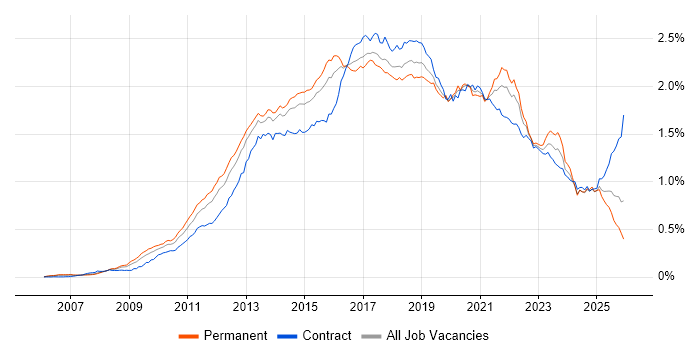
JSON job vacancy trend in England

JSON
Salary Trend in England

Salary distribution trend for jobs in England citing JSON.

Salary distribution trend for jobs in England citing JSON

JSON
Salary Histogram in England

Salary distribution for jobs citing JSON in England over the 6 months to 2 November 2025.

Salary histogram for JSON in England

JSON
Job Locations in England

The table below looks at the demand and provides a guide to the median salaries quoted in IT jobs citing JSON within the England region over the 6 months to 2 November 2025. The 'Rank Change' column provides an indication of the change in demand within each location based on the same 6 month period last year.

Location Rank Change
on Same Period
Last Year
Matching
Permanent
IT Job Ads
Median Salary
Past 6 Months
Median Salary
% Change
on Same Period
Last Year
Live
Jobs
London +5 96 £70,000 - 84
South East -9 81 £62,500 +8.70% 72
East of England +34 43 £55,000 -15.38% 12
North of England -27 30 £55,000 - 35
Midlands +6 25 £47,500 -9.52% 18
North West -9 23 £55,000 - 24
West Midlands +14 18 £47,500 -17.39% 5
East Midlands +18 7 £60,000 +18.81% 13
South West +25 4 £60,000 +20.00% 14
North East +12 4 £45,000 - 3
Yorkshire -16 3 £43,500 -33.08% 8
JSON
UK

JSON
Co-Occurring Skills & Capabilities in England by Category

The following tables expand on the one above by listing co-occurrences grouped by category. They cover the same employment type, locality and period, with up to 20 co-occurrences shown in each category:

Application Platforms
1 9 (3.28%) SharePoint
2 6 (2.19%) Confluence
2 6 (2.19%) IIS
3 5 (1.82%) Anypoint
3 5 (1.82%) CMS
3 5 (1.82%) Tomcat
4 3 (1.09%) Jupyter
5 2 (0.73%) Apache Airflow
5 2 (0.73%) Oracle Workflow
6 1 (0.36%) Appian
6 1 (0.36%) Headless CMS
6 1 (0.36%) Oracle Service Bus
6 1 (0.36%) Oracle SOA Suite
6 1 (0.36%) WordPress
Applications
1 8 (2.92%) MS Visio
2 7 (2.55%) Microsoft Excel
2 7 (2.55%) Microsoft Office
3 3 (1.09%) Trello
4 1 (0.36%) Adobe Illustrator
4 1 (0.36%) Chatbot
4 1 (0.36%) Microsoft PowerPoint
Business Applications
1 6 (2.19%) Shopify
2 5 (1.82%) NetSuite
3 3 (1.09%) Dynamics CRM
3 3 (1.09%) SAP Business One
4 2 (0.73%) Elite 3E
5 1 (0.36%) Aladdin
5 1 (0.36%) Oracle EBS
5 1 (0.36%) Oracle Financials
Cloud Services
1 101 (36.86%) Azure
2 41 (14.96%) AWS
3 38 (13.87%) GitHub
4 36 (13.14%) Azure DevOps
5 33 (12.04%) Serverless
6 28 (10.22%) Power Automate
7 26 (9.49%) Power Platform
8 23 (8.39%) Amazon EC2
9 22 (8.03%) Amazon ECS
9 22 (8.03%) Amazon EKS
10 16 (5.84%) Azure Service Bus
11 14 (5.11%) PowerApps
11 14 (5.11%) SaaS
12 13 (4.74%) Microsoft 365
12 13 (4.74%) PaaS
13 12 (4.38%) Azure Logic Apps
13 12 (4.38%) Boomi
13 12 (4.38%) GCP
14 11 (4.01%) Azure Cosmos DB
14 11 (4.01%) iPaaS
Communications & Networking
1 8 (2.92%) FTP
2 7 (2.55%) Cisco ISE
2 7 (2.55%) Ethernet
2 7 (2.55%) Firewall
2 7 (2.55%) LAN
2 7 (2.55%) SD-WAN
2 7 (2.55%) WAN
3 4 (1.46%) DMARC
3 4 (1.46%) HTTP
3 4 (1.46%) SSL
4 2 (0.73%) DNS
4 2 (0.73%) HTTPS
5 1 (0.36%) TCP/IP
5 1 (0.36%) VPN
5 1 (0.36%) X.21
Database & Business Intelligence
1 54 (19.71%) Relational Database
2 49 (17.88%) SQL Server
3 28 (10.22%) PostgreSQL
4 22 (8.03%) RDBMS
5 18 (6.57%) MySQL
6 17 (6.20%) Power BI
7 14 (5.11%) OLTP
8 11 (4.01%) Data Warehouse
9 9 (3.28%) NoSQL
9 9 (3.28%) SQL Server Integration Services
10 8 (2.92%) Elasticsearch
10 8 (2.92%) GIS
11 6 (2.19%) Redis
12 5 (1.82%) MongoDB
13 4 (1.46%) Power Query
14 3 (1.09%) Azure SQL Database
14 3 (1.09%) Crystal Reports
15 2 (0.73%) Big Data
15 2 (0.73%) Data Mining
15 2 (0.73%) SQL Server Reporting Services
Development Applications
1 42 (15.33%) Git
2 29 (10.58%) Jenkins
3 24 (8.76%) JMeter
3 24 (8.76%) JUnit
4 22 (8.03%) Mockito
5 13 (4.74%) JIRA
5 13 (4.74%) Visual Studio
6 8 (2.92%) MSBuild
6 8 (2.92%) Octopus Deploy
6 8 (2.92%) Team Foundation Server
7 7 (2.55%) Selenium
8 6 (2.19%) Axure RP
8 6 (2.19%) Postman
9 4 (1.46%) webpack
10 2 (0.73%) Babel
10 2 (0.73%) ESLint
10 2 (0.73%) Katalon Studio
10 2 (0.73%) Storybook
10 2 (0.73%) WebDriver
11 1 (0.36%) REST Assured
General
1 101 (36.86%) Social Skills
2 48 (17.52%) Analytical Skills
3 42 (15.33%) Law
4 37 (13.50%) Finance
5 34 (12.41%) Retail
6 30 (10.95%) Public Sector
7 16 (5.84%) Marketing
8 8 (2.92%) Legal
9 6 (2.19%) Front Office
10 5 (1.82%) Inclusion and Diversity
10 5 (1.82%) Organisational Skills
11 4 (1.46%) Automotive
11 4 (1.46%) Czech Language
11 4 (1.46%) Presentation Skills
12 3 (1.09%) German Language
12 3 (1.09%) Publishing
13 2 (0.73%) Banking
13 2 (0.73%) Documentation Skills
14 1 (0.36%) Billing
14 1 (0.36%) Influencing Skills
Job Titles
1 127 (46.35%) Developer
2 41 (14.96%) Senior
3 37 (13.50%) Senior Developer
4 26 (9.49%) Full-Stack Developer
5 23 (8.39%) Analyst
6 21 (7.66%) Java Developer
7 18 (6.57%) Full-Stack Java Developer
8 17 (6.20%) Architect
9 15 (5.47%) Mid-Level Java Developer
10 14 (5.11%) Consultant
10 14 (5.11%) Oracle Developer
10 14 (5.11%) Senior Oracle Developer
11 13 (4.74%) Lead
11 13 (4.74%) ServiceNow Consultant
12 12 (4.38%) Data Engineer
12 12 (4.38%) Integration Engineer
12 12 (4.38%) SQL Developer
12 12 (4.38%) Support Consultant
13 11 (4.01%) Front-End Developer (Client-Side Developer)
14 9 (3.28%) ServiceNow Developer
Libraries, Frameworks & Software Standards
1 166 (60.58%) XML
2 130 (47.45%) REST
3 119 (43.43%) HTML
4 65 (23.72%) CSS
5 48 (17.52%) Web Services
6 31 (11.31%) .NET
6 31 (11.31%) React
7 30 (10.95%) SOAP
8 23 (8.39%) jQuery
9 22 (8.03%) ActiveMQ
9 22 (8.03%) Apache Camel
9 22 (8.03%) Hibernate
9 22 (8.03%) Spring
9 22 (8.03%) Spring Boot
9 22 (8.03%) WireMock
10 21 (7.66%) RESTful
11 16 (5.84%) AngularJS
11 16 (5.84%) ASP.NET
12 12 (4.38%) YAML
13 11 (4.01%) OAuth
Miscellaneous
1 27 (9.85%) Onboarding
2 26 (9.49%) Self-Motivation
3 25 (9.12%) Distributed Systems
4 13 (4.74%) Low-Code
5 12 (4.38%) Product Ownership
6 10 (3.65%) Cloud Native
6 10 (3.65%) Linux Command Line
6 10 (3.65%) Operational Technology
7 8 (2.92%) Data Centre
7 8 (2.92%) Data Protection Act
7 8 (2.92%) Data Structures
8 7 (2.55%) Public Cloud
9 6 (2.19%) BYOD
10 5 (1.82%) Enterprise Software
10 5 (1.82%) Mobile App
11 3 (1.09%) Social Media
12 2 (0.73%) Analytical Mindset
12 2 (0.73%) Blog
12 2 (0.73%) Management Information System
12 2 (0.73%) Security Posture
Operating Systems
1 20 (7.30%) Unix
2 15 (5.47%) Linux
3 8 (2.92%) Windows
4 4 (1.46%) Android
5 3 (1.09%) Mac OS
6 2 (0.73%) Apple iOS
6 2 (0.73%) Windows Server
Processes & Methodologies
1 99 (36.13%) Agile
2 86 (31.39%) Problem-Solving
3 64 (23.36%) CI/CD
4 59 (21.53%) DevOps
5 53 (19.34%) Microservices
6 36 (13.14%) Full-Stack Development
6 36 (13.14%) SDLC
7 34 (12.41%) Test Automation
8 33 (12.04%) ETL
9 32 (11.68%) Workflow
10 30 (10.95%) AI
10 30 (10.95%) API Integration
11 28 (10.22%) BDD
11 28 (10.22%) User Experience
12 27 (9.85%) Continuous Improvement
12 27 (9.85%) TDD
13 26 (9.49%) Mentoring
14 25 (9.12%) CRM
14 25 (9.12%) Data Modelling
15 24 (8.76%) Problem Management
Programming Languages
1 136 (49.64%) JavaScript
2 127 (46.35%) SQL
3 78 (28.47%) Python
4 54 (19.71%) Java
5 52 (18.98%) C#
6 35 (12.77%) PowerShell
7 27 (9.85%) Shell Script
8 16 (5.84%) PL/SQL
9 14 (5.11%) TypeScript
10 11 (4.01%) T-SQL
11 7 (2.55%) PHP
12 5 (1.82%) Go
13 4 (1.46%) Bicep
13 4 (1.46%) VBA
14 2 (0.73%) C++
14 2 (0.73%) Data Analysis Expressions
14 2 (0.73%) Kotlin
14 2 (0.73%) Ruby
15 1 (0.36%) Dart
15 1 (0.36%) Swift
Qualifications
1 25 (9.12%) Degree
2 24 (8.76%) Security Cleared
3 9 (3.28%) SC Cleared
4 5 (1.82%) Computer Science Degree
5 3 (1.09%) BPSS Clearance
5 3 (1.09%) DBS Check
5 3 (1.09%) Master's Degree
6 2 (0.73%) ISTQB
7 1 (0.36%) A+ Certification
7 1 (0.36%) Network+ Certification
7 1 (0.36%) PhD
Quality Assurance & Compliance
1 26 (9.49%) QA
2 16 (5.84%) GDPR
2 16 (5.84%) ISO/IEC 27001
3 14 (5.11%) Data Quality
4 12 (4.38%) Accessibility
5 10 (3.65%) NCSC
5 10 (3.65%) NIST
6 3 (1.09%) HL7
7 1 (0.36%) DICOM
System Software
1 50 (18.25%) Docker
2 7 (2.55%) VMware NSX
3 6 (2.19%) Active Directory
Systems Management
1 38 (13.87%) Kubernetes
2 22 (8.03%) Kibana
3 12 (4.38%) Terraform
4 9 (3.28%) Ansible
4 9 (3.28%) Single Sign-On
5 7 (2.55%) FortiGate
6 4 (1.46%) Microsoft Intune
7 2 (0.73%) Grafana
8 1 (0.36%) Packer
Vendors
1 42 (15.33%) Microsoft
2 27 (9.85%) Oracle
3 25 (9.12%) ServiceNow
4 23 (8.39%) Splunk
5 22 (8.03%) Dynatrace
6 15 (5.47%) Cisco
7 13 (4.74%) Google
8 9 (3.28%) MuleSoft
9 8 (2.92%) SAP
10 7 (2.55%) Blue Coat
10 7 (2.55%) CheckPoint
10 7 (2.55%) F5
10 7 (2.55%) Informatica
10 7 (2.55%) Salesforce
10 7 (2.55%) VMware
11 6 (2.19%) Dell
11 6 (2.19%) HubSpot
11 6 (2.19%) SnapLogic
11 6 (2.19%) Talend
11 6 (2.19%) Trayport