XML Jobs in England

XML
UK > England

The table below provides summary statistics for permanent job vacancies advertised in England requiring XML skills. It includes a benchmarking guide to the annual salaries offered in vacancies that cited XML over the 6 months leading up to 16 May 2025, comparing them to the same period in the previous two years.

6 months to
16 May 2025
Same period 2024 Same period 2023
Rank 349 309 306
Rank change year-on-year -40 -3 -70
Permanent jobs citing XML 398 791 1,003
As % of all permanent jobs advertised in England 0.81% 0.92% 1.13%
As % of the Libraries, Frameworks & Software Standards category 4.58% 4.54% 3.77%
Number of salaries quoted 331 569 791
10th Percentile £36,250 £35,000 £40,000
25th Percentile £45,000 £43,750 £49,500
Median annual salary (50th Percentile) £57,500 £60,000 £62,500
Median % change year-on-year -4.17% -4.00% +8.70%
75th Percentile £78,750 £73,750 £77,715
90th Percentile £83,750 £85,000 £92,500
UK median annual salary £57,500 £58,000 £62,500
% change year-on-year -0.86% -7.20% +9.65%

All Software Libraries and Frameworks
England

XML falls under the Software Libraries and Frameworks category. For comparison with the information above, the following table provides summary statistics for all permanent job vacancies requiring technical specification, industry standards, software libraries and framework skills in England.

Permanent vacancies with a requirement for technical specification, industry standards, software libraries and framework skills 8,694 17,424 26,593
As % of all permanent jobs advertised in England 17.67% 20.29% 29.97%
Number of salaries quoted 5,650 14,136 16,492
10th Percentile £38,750 £36,250 £41,250
25th Percentile £51,250 £45,250 £51,250
Median annual salary (50th Percentile) £66,252 £60,000 £67,500
Median % change year-on-year +10.42% -11.11% +3.85%
75th Percentile £87,500 £80,000 £88,750
90th Percentile £112,500 £100,000 £108,750
UK median annual salary £65,000 £60,000 £67,500
% change year-on-year +8.33% -11.11% +6.30%

XML
Job Vacancy Trend in England

Job postings citing XML as a proportion of all IT jobs advertised in England.
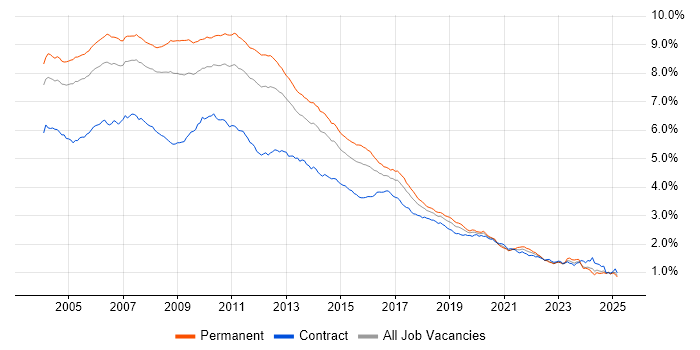
Job vacancy trend for XML in England

XML
Salary Trend in England

3-month moving average salary quoted in jobs citing XML in England.

Salary trend for XML in England

XML
Salary Histogram in England

Salary distribution for jobs citing XML in England over the 6 months to 16 May 2025.

Salary histogram for XML in England

XML
Job Locations in England

The table below looks at the demand and provides a guide to the median salaries quoted in IT jobs citing XML within the England region over the 6 months to 16 May 2025. The 'Rank Change' column provides an indication of the change in demand within each location based on the same 6 month period last year.

Location Rank Change
on Same Period
Last Year
Matching
Permanent
IT Job Ads
Median Salary
Past 6 Months
Median Salary
% Change
on Same Period
Last Year
Live
Jobs
South East +41 135 £65,000 +8.33% 77
London -16 116 £65,000 -7.14% 175
North of England -3 54 £50,055 -6.88% 31
North West -23 39 £50,055 -1.85% 17
East of England +19 28 £47,500 +18.75% 17
South West +52 24 £37,000 -22.11% 25
Midlands -2 22 £54,344 -1.19% 34
Yorkshire +49 14 £37,500 -34.78% 12
West Midlands -1 13 £53,688 -2.39% 13
East Midlands +25 9 £55,000 -8.33% 21
North East +38 1 £35,000 -31.71% 2
XML
UK

XML
Co-occurring Skills and Capabilities in England by Category

The follow tables expand on the table above by listing co-occurrences grouped by category. The same employment type, locality and period is covered with up to 20 co-occurrences shown in each of the following categories:

Application Platforms
1 15 (3.77%) IIS
2 14 (3.52%) Tomcat
3 11 (2.76%) SharePoint
4 8 (2.01%) Confluence
4 8 (2.01%) Oracle SOA Suite
5 6 (1.51%) OpenEdge
6 5 (1.26%) Mule
6 5 (1.26%) WordPress
7 3 (0.75%) Apache
7 3 (0.75%) Apache Airflow
7 3 (0.75%) Oracle Coherence
8 2 (0.50%) CMS
8 2 (0.50%) Oracle Service Bus
8 2 (0.50%) WebSphere
9 1 (0.25%) Anypoint
9 1 (0.25%) Microsoft Exchange
9 1 (0.25%) Oracle Application Server
9 1 (0.25%) Oracle Workflow
9 1 (0.25%) Sitefinity
9 1 (0.25%) Umbraco
Applications
1 26 (6.53%) Microsoft Office
2 19 (4.77%) Microsoft Excel
3 7 (1.76%) MS Visio
4 3 (0.75%) Microsoft PowerPoint
4 3 (0.75%) Microsoft Project
Business Applications
1 44 (11.06%) NetSuite
2 15 (3.77%) Dynamics CRM
3 11 (2.76%) JDE OneWorld
3 11 (2.76%) Payment Gateway
4 9 (2.26%) Magento
5 5 (1.26%) Q-Pulse
6 3 (0.75%) Elite 3E
6 3 (0.75%) Oracle EBS
7 2 (0.50%) Adobe Campaign
7 2 (0.50%) Aladdin
7 2 (0.50%) SAP Oil and Gas
8 1 (0.25%) Fidessa
8 1 (0.25%) Odoo
8 1 (0.25%) Oracle EBS R12
8 1 (0.25%) Oracle Financials
8 1 (0.25%) Oracle General Ledger
8 1 (0.25%) Oracle Payables
8 1 (0.25%) Oracle Receivables
8 1 (0.25%) Remedy ITSM
Cloud Services
1 122 (30.65%) Azure
2 57 (14.32%) Azure DevOps
3 46 (11.56%) Azure Service Bus
4 44 (11.06%) Power Platform
5 33 (8.29%) Azure Cosmos DB
5 33 (8.29%) Power Automate
5 33 (8.29%) SonarCloud
6 29 (7.29%) AWS
7 23 (5.78%) PowerApps
8 22 (5.53%) Boomi
8 22 (5.53%) SaaS
9 20 (5.03%) Azure Logic Apps
9 20 (5.03%) Microsoft 365
10 18 (4.52%) Azure Data Factory
10 18 (4.52%) GitHub
10 18 (4.52%) Serverless
11 17 (4.27%) Dynamics 365
12 10 (2.51%) Azure Functions
13 9 (2.26%) Salesforce Commerce Cloud
14 8 (2.01%) Entra ID
Communications & Networking
1 14 (3.52%) SSL
2 13 (3.27%) FTP
3 11 (2.76%) HTTP
4 10 (2.51%) Internet
5 8 (2.01%) DMARC
6 6 (1.51%) TCP/IP
7 3 (0.75%) DNS
7 3 (0.75%) Ethernet
7 3 (0.75%) SSH
7 3 (0.75%) VPN
8 2 (0.50%) Firewall
8 2 (0.50%) HTTPS
8 2 (0.50%) LAN
8 2 (0.50%) RTP
8 2 (0.50%) WAN
9 1 (0.25%) FIX Connectivity
9 1 (0.25%) SMTP
9 1 (0.25%) X.21
Database & Business Intelligence
1 113 (28.39%) SQL Server
2 37 (9.30%) MySQL
2 37 (9.30%) SQL Server Reporting Services
3 34 (8.54%) Power BI
4 33 (8.29%) Elasticsearch
5 22 (5.53%) Relational Database
6 15 (3.77%) OLTP
6 15 (3.77%) PostgreSQL
7 11 (2.76%) SQL Server Integration Services
8 9 (2.26%) Data Warehouse
8 9 (2.26%) RDBMS
9 7 (1.76%) Azure SQL Database
9 7 (1.76%) Tableau
10 5 (1.26%) BusinessObjects
10 5 (1.26%) NoSQL
11 4 (1.01%) Metadata
11 4 (1.01%) Oracle Reports
12 3 (0.75%) MariaDB
13 2 (0.50%) Oracle ODI
13 2 (0.50%) Triplestore
Development Applications
1 98 (24.62%) Git
2 59 (14.82%) Visual Studio
3 38 (9.55%) Octopus Deploy
4 36 (9.05%) Team Foundation Server
5 33 (8.29%) MSBuild
6 27 (6.78%) JIRA
7 17 (4.27%) Jenkins
8 15 (3.77%) Postman
8 15 (3.77%) Selenium
9 14 (3.52%) MagicDraw
10 9 (2.26%) JMeter
11 7 (1.76%) ClearCase
11 7 (1.76%) JUnit
11 7 (1.76%) Rational DOORS
12 6 (1.51%) Mockito
13 5 (1.26%) Maven
13 5 (1.26%) Subversion
14 4 (1.01%) Eclipse
14 4 (1.01%) SoapUI
14 4 (1.01%) TeamCity
General
1 137 (34.42%) Social Skills
2 43 (10.80%) Retail
3 41 (10.30%) Finance
4 32 (8.04%) Analytical Skills
5 28 (7.04%) Marketing
6 18 (4.52%) Banking
7 15 (3.77%) Public Sector
8 9 (2.26%) Local Government
8 9 (2.26%) Organisational Skills
9 8 (2.01%) Czech Language
9 8 (2.01%) Documentation Skills
9 8 (2.01%) Military
9 8 (2.01%) Presentation Skills
10 7 (1.76%) Aerospace
10 7 (1.76%) Investment Banking
11 6 (1.51%) Inclusion and Diversity
11 6 (1.51%) Law
12 5 (1.26%) Aviation
12 5 (1.26%) Legal
12 5 (1.26%) Manufacturing
Job Titles
1 187 (46.98%) Developer
2 90 (22.61%) Senior
3 67 (16.83%) Senior Developer
4 45 (11.31%) Architect
5 39 (9.80%) Analyst
6 37 (9.30%) Technical Architect
7 34 (8.54%) Lead
8 22 (5.53%) Software Engineer
9 21 (5.28%) Software Developer
9 21 (5.28%) SQL Developer
10 20 (5.03%) NetSuite Developer
10 20 (5.03%) Support Analyst
11 19 (4.77%) .NET Developer
11 19 (4.77%) Portal Developer
12 18 (4.52%) Consultant
12 18 (4.52%) Technical Consultant
13 17 (4.27%) C# Developer
14 16 (4.02%) Oracle Developer
14 16 (4.02%) Senior Software Developer
15 15 (3.77%) Senior Oracle Developer
Libraries, Frameworks & Software Standards
1 194 (48.74%) JSON
2 183 (45.98%) HTML
3 146 (36.68%) .NET
4 121 (30.40%) REST
5 115 (28.89%) CSS
6 106 (26.63%) SOAP
7 84 (21.11%) ASP.NET
8 79 (19.85%) Web Services
9 55 (13.82%) .NET Core
10 49 (12.31%) .NET Framework
11 42 (10.55%) Bootstrap
12 33 (8.29%) AngularJS
12 33 (8.29%) gRPC
13 30 (7.54%) React
14 26 (6.53%) ASP.NET Web API
14 26 (6.53%) jQuery
14 26 (6.53%) Middleware
15 24 (6.03%) Restlet
16 21 (5.28%) Hibernate
17 20 (5.03%) OAuth
Miscellaneous
1 27 (6.78%) Mobile App
2 20 (5.03%) Legacy Systems
3 13 (3.27%) Enterprise Software
4 12 (3.02%) Cloud Native
4 12 (3.02%) Data Structures
4 12 (3.02%) Embedded Systems
5 11 (2.76%) Virtual Team
6 10 (2.51%) Client/Server
6 10 (2.51%) Self-Motivation
7 9 (2.26%) Management Information System
7 9 (2.26%) Product Ownership
8 7 (1.76%) Distributed Systems
9 6 (1.51%) Low-Code
10 5 (1.26%) Analytical Mindset
10 5 (1.26%) Blog
10 5 (1.26%) e-Learning
10 5 (1.26%) Foreign Exchange (FX)
10 5 (1.26%) Reference Data
11 4 (1.01%) CMDB
11 4 (1.01%) Robotics
Operating Systems
1 24 (6.03%) Windows
2 22 (5.53%) Linux
3 16 (4.02%) Unix
4 7 (1.76%) Windows Server
5 4 (1.01%) Android
5 4 (1.01%) Apple iOS
6 2 (0.50%) AIX
6 2 (0.50%) CentOS
6 2 (0.50%) Oracle Linux
Processes & Methodologies
1 133 (33.42%) Problem-Solving
2 116 (29.15%) Agile
3 79 (19.85%) DevOps
4 70 (17.59%) Data Modelling
5 69 (17.34%) Microservices
6 61 (15.33%) Migration
7 57 (14.32%) API Integration
7 57 (14.32%) MVC
8 56 (14.07%) Project Management
9 51 (12.81%) Software Engineering
10 48 (12.06%) Performance Optimisation
11 45 (11.31%) Workflow
12 43 (10.80%) Test Automation
12 43 (10.80%) User Experience
13 41 (10.30%) Code Quality
14 39 (9.80%) CRM
14 39 (9.80%) Design Patterns
14 39 (9.80%) UML
15 36 (9.05%) OO
15 36 (9.05%) Software Testing
Programming Languages
1 229 (57.54%) SQL
2 162 (40.70%) JavaScript
3 133 (33.42%) C#
4 53 (13.32%) Java
5 49 (12.31%) Python
6 26 (6.53%) PL/SQL
7 25 (6.28%) PowerShell
8 19 (4.77%) C
8 19 (4.77%) PHP
9 18 (4.52%) T-SQL
9 18 (4.52%) TypeScript
10 14 (3.52%) C++
11 13 (3.27%) Shell Script
12 12 (3.02%) Ada
13 9 (2.26%) VBA
14 6 (1.51%) R
14 6 (1.51%) VB.NET
15 5 (1.26%) SPARQL
15 5 (1.26%) XQuery
16 4 (1.01%) Perl
Qualifications
1 39 (9.80%) Degree
2 36 (9.05%) BPSS Clearance
3 17 (4.27%) Security Cleared
4 11 (2.76%) SC Cleared
5 5 (1.26%) Computer Science Degree
5 5 (1.26%) HNC
5 5 (1.26%) HND
6 4 (1.01%) Azure Certification
6 4 (1.01%) Microsoft Certification
7 2 (0.50%) A+ Certification
7 2 (0.50%) CompTIA Security+
7 2 (0.50%) DBS Check
7 2 (0.50%) Master's Degree
7 2 (0.50%) TOGAF Certification
8 1 (0.25%) DV Cleared
8 1 (0.25%) ISTQB
8 1 (0.25%) Numerate Degree
8 1 (0.25%) PMI Certification
Quality Assurance & Compliance
1 36 (9.05%) GDPR
2 17 (4.27%) ISO/IEC 27001
3 16 (4.02%) Accessibility
4 15 (3.77%) QA
5 14 (3.52%) Data Quality
6 3 (0.75%) PMO
7 2 (0.50%) Dublin Core
7 2 (0.50%) EMIR
7 2 (0.50%) ISO 20022
7 2 (0.50%) ISO 9001
7 2 (0.50%) MiFID
7 2 (0.50%) Sarbanes-Oxley
7 2 (0.50%) SEPA
7 2 (0.50%) SLA
8 1 (0.25%) HL7
8 1 (0.25%) PCI DSS
8 1 (0.25%) WCAG
System Software
1 63 (15.83%) Docker
2 10 (2.51%) Active Directory
3 2 (0.50%) KVM
3 2 (0.50%) Postfix
3 2 (0.50%) Sendmail
Systems Management
1 19 (4.77%) Kubernetes
2 17 (4.27%) Single Sign-On
3 8 (2.01%) Microsoft Intune
4 6 (1.51%) Kibana
5 3 (0.75%) Control-M
6 2 (0.50%) Grafana
6 2 (0.50%) Graylog
6 2 (0.50%) MIIS
6 2 (0.50%) Nagios
6 2 (0.50%) Nessus
7 1 (0.25%) CEMLI
7 1 (0.25%) CloudHub
7 1 (0.25%) HP UCMDB
Vendors
1 88 (22.11%) Microsoft
2 56 (14.07%) Oracle
3 14 (3.52%) Salesforce
4 13 (3.27%) MuleSoft
5 12 (3.02%) Dell
6 11 (2.76%) Adobe
7 9 (2.26%) New Relic
8 8 (2.01%) Dynatrace
8 8 (2.01%) Google
8 8 (2.01%) ServiceNow
8 8 (2.01%) Splunk
9 7 (1.76%) Databricks
9 7 (1.76%) Talend
10 5 (1.26%) IBM
10 5 (1.26%) Screaming Frog
11 4 (1.01%) Bloomberg
11 4 (1.01%) Informatica
11 4 (1.01%) Intapp
12 3 (0.75%) Ahrefs
12 3 (0.75%) Solace